
NCHS Data Brief
Number 95, May 2012
Hospitalization for Stroke in U.S. Hospitals, 1989–2009
On This Page
- Key findings
- Has the rate of hospitalization for stroke changed from 1989 to 2009?
- Have the characteristics of persons hospitalized for stroke changed between 1989 and 2009?
- What is the relationship between age and hospitalization for stroke?
- Did the length of hospital stay for stroke inpatients change from 1989 to 2009?
- Was there a change in the discharge status of stroke patients from 1989 to 2009?
- Summary
- Definitions
- Data source and methods
- About the authors
- References
- Suggested citation
PDF Version
 (632 KB)
Margaret Jean Hall, Ph.D.; Shaleah Levant, M.P.H.; and Carol J. DeFrances, Ph.D.
Key findings
- The rate of hospitalization for stroke (cerebrovascular disease) per 10,000 population increased from 32.4 in 1989 to 34.9 in 1999, and then decreased to 31.8 in 2009.
- About 800,000 hospitalizations for stroke occurred in 1989 and almost 1 million in 1999 and 2009. More than two-thirds of these hospitalizations were for patients aged 65 and over.
- The stroke hospitalization rate from 1999 to 2009 decreased 20% for those aged 65–74 and 85 and over, and 24% for those aged 75–84.
- The rate of hospitalization for older stroke patients increased with advancing age in 1989, 1999, and 2009.
- The average length of stay for stroke patients was similar in 1999 (5.4 days) and 2009 (5.3 days). These stays were significantly shorter than the 10.2-day average stay in 1989.
- A smaller proportion of stroke patients died in the hospital in 2009 (5%) than in 1989 (9%).
Numerous public health campaigns have sought to educate the public on how to lower stroke risk: for example, by increasing physical activity, controlling weight, stopping smoking, and taking medication to lower high blood pressure and high cholesterol (4,5). This report examines nationally representative data from 1989 to 2009 to see how inpatient hospital care for stroke has changed.
Keywords: inpatient care, health care utilization, cerebrovascular disease, National Hospital Discharge Survey
Has the rate of hospitalization for stroke changed from 1989 to 2009?
- The rate of hospitalization for stroke increased from 32.4 to 34.9 per 10,000 population from 1989 to 1999, but by 2009 the rate had decreased to 31.8 per 10,000 (Figure 1).
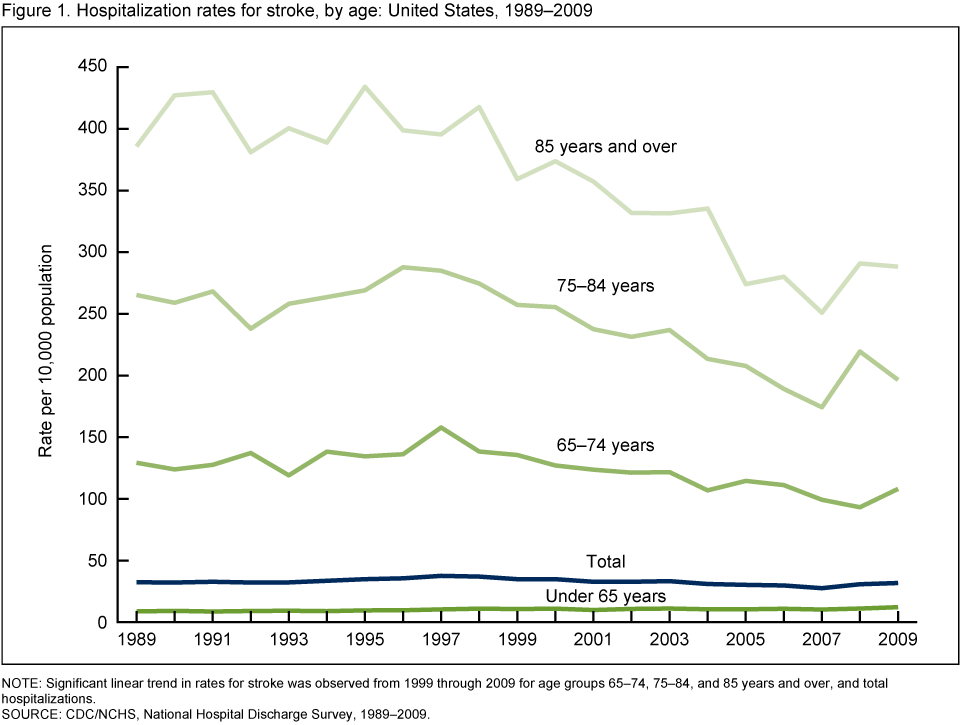
NOTE: Significant linear trend in rates for stroke was observed from 1999 through 2009 for age groups 65–74, 75–84, and 85 years and over, and for total hospitalizations.
SOURCE: CDC/NCHS, National Hospital Discharge Survey, 1989–2009.
SOURCE: CDC/NCHS, National Hospital Discharge Survey, 1989–2009.
- The stroke hospitalization rate increased 5% for those aged 65–74 from 1989 to 1999, and then decreased 20% from 1999 to 2009. For those aged 75 and over, the rates did not change significantly from 1989 to 1999, but from 1999 to 2009 the rate decreased 24% for those aged 75–84 and 20% for those 85 and over.
Have the characteristics of persons hospitalized for stroke changed between 1989 and 2009?
- There were close to 800,000 hospitalizations for stroke in 1989 and almost 1 million in both 1999 and 2009 (see Table).
- In 1989, the proportion of those hospitalized for stroke who were male was 43%, but by 2009 the share of males and females was similar.
- The average age of stroke patients (70–71 years) was similar in 1989, 1999, and 2009.
Table. Number and characteristics of hospitalizations for stroke: United States, 1989, 1999, and 2009
| Characteristic | 1989 | 1999 | 2009 |
|---|---|---|---|
| Total stroke hospitalizations | 795,000 | 961,000 | 971,000 |
| Average age of hospital inpatients (years) | 71 | 71 | 70 |
| Percent | |||
| Proportion by sex | |||
| Male | 43 | 45 | 48 |
| Female | 57 | 55 | 52 |
| Proportion by age group | |||
| Under 65 years | 24 | 27 | 34 |
| 65 years and over | 76 | 73 | 66 |
| Proportion with comorbidities | |||
| Diabetes | 18 | 23 | 23 |
| Hypertension | 37 | 55 | 58 |
| Atrial fibrillation | 10 | 12 | 12 |
| At least one of the above comorbidities1 | 65 | 91 | 94 |
1Percentage of stroke inpatients with one or more of the above comorbidities in diagnostic fields 2 through 7 on the National Hospital Discharge Survey patient medical abstract form.
SOURCE: CDC/NCHS, National Hospital Discharge Survey, 1989, 1999, and 2009.
SOURCE: CDC/NCHS, National Hospital Discharge Survey, 1989, 1999, and 2009.
- The percentage of stroke hospitalizations with a comorbidity (secondary diagnosis) of diabetes rose from 18% in 1989 to 23% in 1999, but remained the same from 1999 to 2009. Stroke hospitalizations with a comorbidity of hypertension increased from 37% in 1989 to 55% in 1999. In 2009 the percentage with hypertension was 58%, but this was not a significant change from 1999. These conditions, as well as atrial fibrillation (which did not change over this time period), have been shown to increase the risk of stroke (1).
What is the relationship between age and hospitalization for stroke?
- The rate of hospitalization for stroke for the population aged 65 and over increased with age in 1989, 1999, and 2009 (Figure 2).
- The rate of hospitalization for stroke for those aged 85 and over was three times the rate for those aged 65–74 in 1989, and in 1999 and 2009 it was more than two and one-half times greater for the group aged 85 and over compared with those aged 65–74.
Figure 2. Hospitalization rates for stroke for those aged 65 and over: United States, 1989, 1999, and 2009
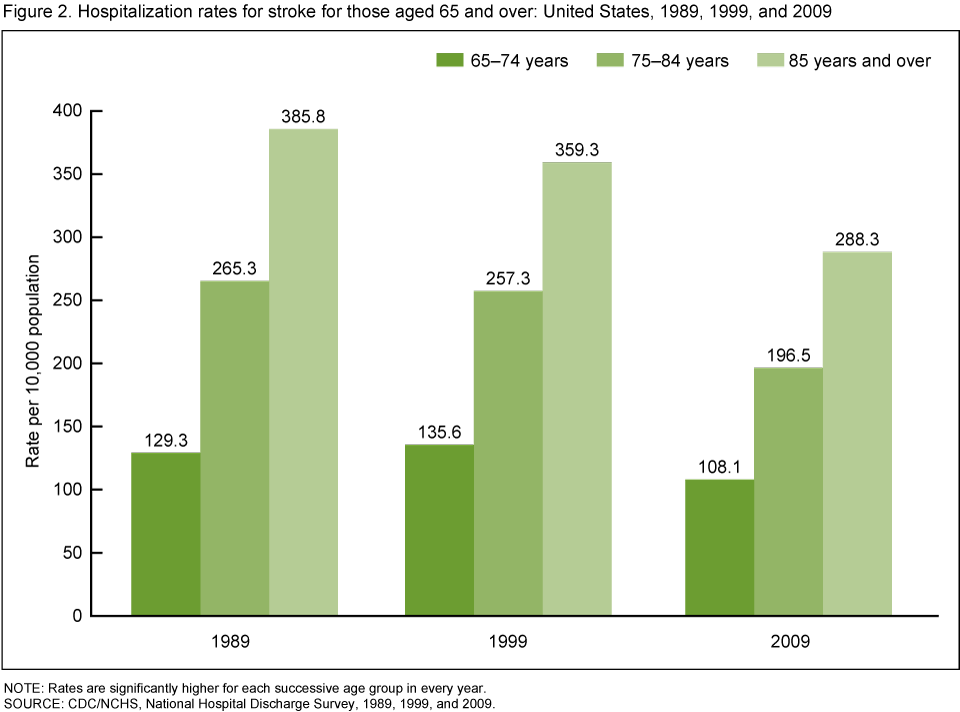
NOTE: Rates are significantly higher for each successive age group in every year.
SOURCE: CDC/NCHS, National Hospital Discharge Survey, 1989, 1999, and 2009.
SOURCE: CDC/NCHS, National Hospital Discharge Survey, 1989, 1999, and 2009.
Did the length of hospital stay for stroke inpatients change from 1989 to 2009?
- The average length of stay for stroke patients was 10.2 days in 1989, 5.4 days in 1999, and 5.3 days in 2009 (Figure 3).
- From 1989 to 1999, the average length of stay for stroke patients decreased 47%. During this same period, the length of stay for all hospitalizations decreased 23%.
- From 2000 to 2009, the average length of stay for all patients, as well as for stroke patients, did not change significantly.
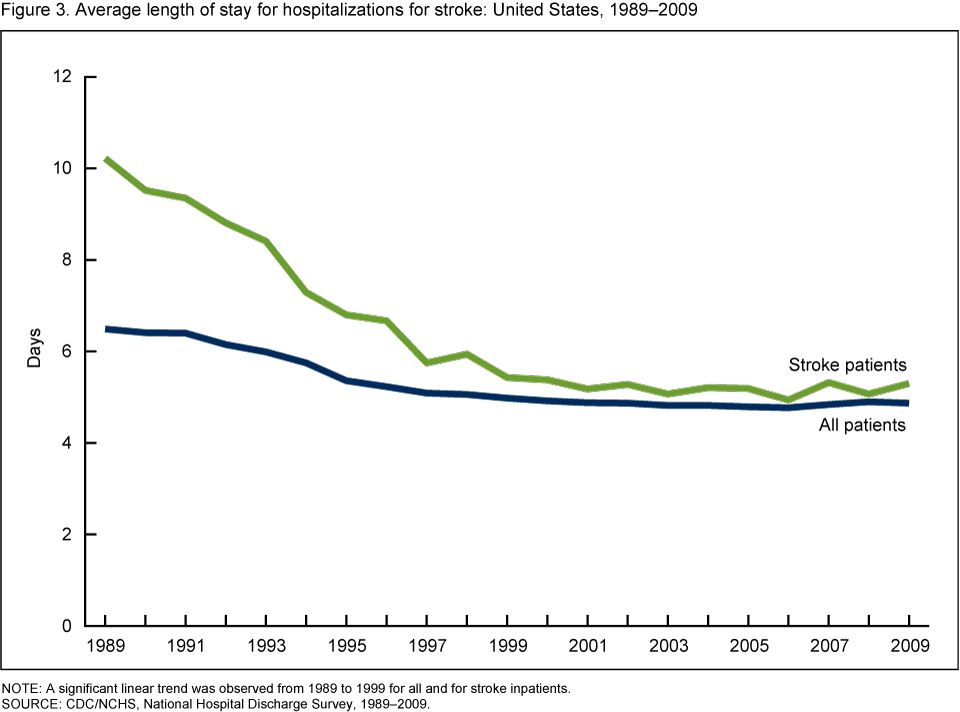
NOTE: A significant linear trend was observed from 1989 to 1999 for all and for stroke inpatients.
SOURCE: CDC/NCHS, National Hospital Discharge Survey, 1989–2009.
SOURCE: CDC/NCHS, National Hospital Discharge Survey, 1989–2009.
Was there a change in the discharge status of stroke patients from 1989 to 2009?
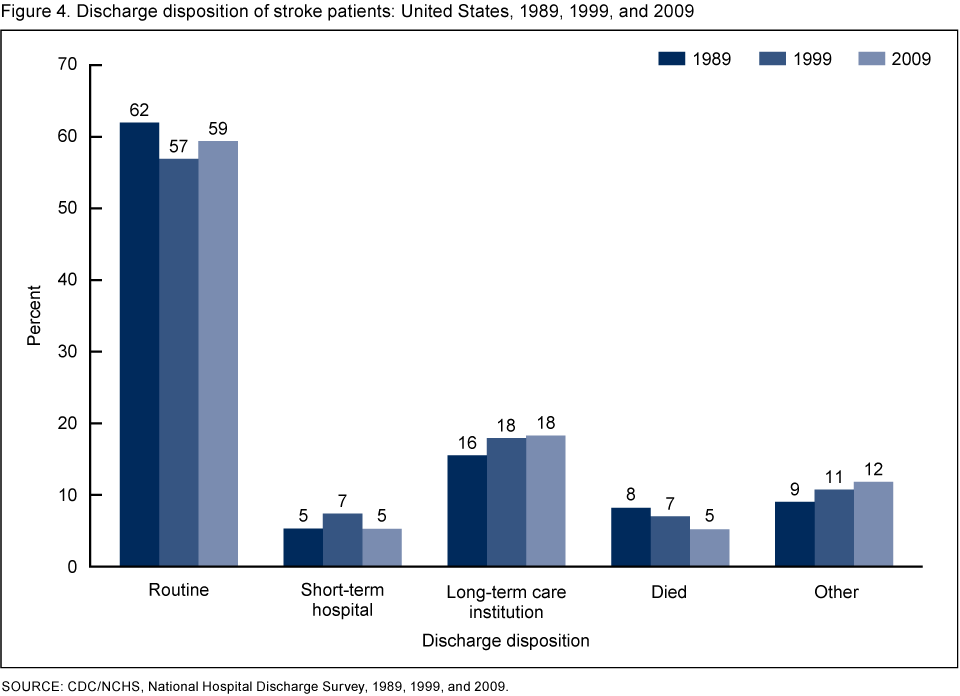
- In 1989, 1999, and 2009, similar proportions of patients hospitalized for stroke were routinely discharged (generally to home), discharged to other short-term hospitals, or discharged to long-term care institutions (Figure 4).
- In 1989 and 1999, similar proportions of stroke patients died in the hospital, but in 2009 the percentage who died in the hospital was significantly lower than in 1989.
- Although stroke inpatients made up only about 3% of total hospitalizations, they died at more than twice the rate of other patients in 1989, 1999, and 2009 (data not shown).
SOURCE: CDC/NCHS, National Hospital Discharge Survey, 1989, 1999, and 2009.
Summary
Stroke remains one of the most significant U.S. health problems (6). Although the stroke hospitalization rate has declined, in 2009 there were still almost 1 million hospitalizations for stroke. Many stroke patients, upon discharge, went to another short-stay hospital or a long-term care institution. In addition, outpatient or in-home services (including rehabilitation) are often provided to those who have had a stroke, to prevent future strokes and to restore functioning (6,7).In 2011, the U.S. Department of Health and Human Services announced its "Million Hearts" campaign, which aims to prevent 1 million heart attacks and strokes over the next 5 years (8). Efforts like this are especially important because the baby boomer population is aging into the years when strokes are more common. It is important to continue to track the number and rate of stroke hospitalizations, in order to gauge the effects of campaigns like Million Hearts as well as the effectiveness of provisions in health care legislation (including the Patient Protection and Affordable Care Act) that promote preventive care and coordination of care.
Definitions
Stroke (cerebrovascular disease): An interruption in the blood supply to any part of the brain (9).Hospitalization for stroke: A hospitalization with stroke as the principal or first-listed diagnosis. The definition includes hospitalizations for acute stroke, transient ischemic attack, and for late effects of stroke. That is, stroke is the main cause or reason for the hospitalization and is recorded using International Classification of Diseases, Ninth Revision, Clinical Modification (ICD–9–CM) codes 430–438 (10).
Comorbidities (secondary diagnoses): Conditions that are recorded in diagnostic fields 2 through 7 on the National Hospital Discharge Survey (NHDS) patient medical abstract form. The comorbidities included in this report are those discussed as being risk factors for stroke (1): hypertension (high blood pressure), ICD–9–CM codes 401–405; diabetes, code 250; and atrial fibrillation, code 427.31. Inpatients having any of these secondary diagnoses are counted, but not the number of times they have these diagnoses. In other words, if an inpatient had one or more diabetes codes in fields 2 through 7 the patient would still be counted only once.
Rate: The number of hospitalizations per unit of population (i.e., per 10,000 population in this study).
Data source and methods
Data for this report are from NHDS—a national probability sample survey of discharges from nonfederal, short-stay hospitals or general hospitals in the United States, conducted annually by the Centers for Disease Control and Prevention's (CDC) National Center for Health Statistics, Division of Health Care Statistics. NHDS uses a modified three-stage design. Units selected at the first stage consist of either hospitals or geographic areas such as counties, groups of counties, or metropolitan statistical areas. Next, within a sampled geographic area, hospitals are selected. At the last stage, systematic random sampling is used to select discharges within sampled hospitals. Survey data on hospital discharges were obtained from the hospitals' administrative data. Note that if an individual is admitted to the hospital multiple times during the survey year, that individual will be counted more than once in NHDS.Because of the complex multistage design of NHDS, the survey data must be inflated or weighted in order to produce national estimates. Estimates of inpatient care presented in this report exclude newborns. More details about the design of NHDS have been published elsewhere (11).
Trend data from the 2000–2009 NHDS were used in creating Figures 1 and 3. A weighted least squares regression method (12) was used to test the significance of the time trends shown. Figures 2 and 4, and the table, contain data from 1989, 1999, and 2009.
Differences among subgroups were evaluated with two-tailed t tests using p < 0.05 as the level of significance. Terms that express differences, such as "higher," "lower," "largest," "smallest," "leading," "increased," or "decreased," were used only when the differences were statistically significant. When a comparison is described as "similar," it means that no statistically significant difference was found. All comparisons reported in the text were statistically significant unless otherwise indicated. Data analyses were performed using the statistical packages SAS version 9.2 (SAS Institute, Cary, N.C.) and SUDAAN version 10.0 (RTI International, Research Triangle Park, N.C.).
About the authors
Margaret Jean Hall, Shaleah Levant, and Carol J. DeFrances are with CDC's National Center for Health Statistics, Division of Health Care Statistics.References
- Roger VL, Go AS, Lloyd-Jones DM, Benjamin EJ, Berry JD, Borden WB, et al. Heart disease and stroke statistics—2012 update: A report from the American Heart Association. Circulation 125(1):188–97. 2012.
- Kochanek KD, Xu JQ, Murphy SL, et al. Deaths: Preliminary data for 2009
- Murphy SL, Xu JQ, Kochanek KD.Deaths: Preliminary data for 2010
- Goldstein LB, Bushnell RJ, Adams RJ, Appel LJ, Braun LT, Chaturvedi S, et al. Guidelines for the primary prevention of stroke: A guideline for healthcare professionals from the American Heart Association/American Stroke Association. Stroke 42(2):517–84. 2011.
- Brownstein JN. Addressing heart disease and stroke prevention through comprehensive population-level approaches. Prev Chronic Dis 5(2):A31. 2008. Accessed November 2011.
- Demaerschalk BM, Hwang HM, Leung G. U.S. cost burden of ischemic stroke: A systematic literature review. Am J Manag Care. 16(7):525–33. 2010.
- Lee WC, Christensen MC, Joshi AV, Pashos CL. Long-term cost of stroke subtypes among Medicare beneficiaries. Cerebrovasc Dis 23(1):57–65. 2007.
- New public-private sector initiative aims to prevent 1 million heart attacks and strokes in five years
[press release]. HHS News, 13 Sep 2011. U.S. Department of Health and Human Services.
- Stroke
- U.S. Department of Health and Human Services. Centers for Disease Control and Prevention, Centers for Medicare & Medicaid Services. International classification of diseases, ninth revision, clinical modification, 6th ed. DHHS Pub No. (PHS) 06–1260. 2006.
- Hall MJ, DeFrances CJ, Williams SN, Golosinskiy A. National Hospital Discharge Survey: 2007 summary
- Gillum BS, Graves EJ, Kozak LJ. Trends in hospital utilization: United States, 1988–92
Suggested citation
Hall MJ, Levant S, DeFrances CJ. Hospitalization for stroke in U.S. hospitals, 1989–2009. NCHS data brief, no 95. Hyattsville, MD: National Center for Health Statistics. 2012.Copyright information
All material appearing in this report is in the public domain and may be reproduced or copied without permission; citation as to source, however, is appreciated.National Center for Health Statistics
Edward J. Sondik, Ph.D., DirectorJennifer H. Madans, Ph.D., Associate Director for Science


No hay comentarios:
Publicar un comentario