NCHS Data Brief
Number 117, March 2013
Trends in High LDL Cholesterol, Cholesterol-lowering Medication Use, and Dietary Saturated-fat Intake: United States, 1976–2010
On This Page
- Key findings
- The prevalence of high LDL–C decreased from 1976–1980 to 2007–2010.
- The use of cholesterol-lowering medications increased from 1976–1980 through 2007–2010.
- An increased percentage of adults met guidelines for low saturated-fat intake from 1976–1980 to 1988–1994, but the percentage remained unchanged from 1988–1994 through 2007–2010.
- Trends are apparent in the prevalence of high LDL–C levels, medication use, and dietary intake of low saturated fat.
- Summary
- Definitions
- Data source and methods
- About the authors
- References
- Suggested citation
 (481 KB)
Elena V. Kuklina, M.D., Ph.D.; Margaret D. Carroll, M.S.P.H.; Kate M. Shaw, M.S.; and Rosemarie Hirsch, M.D., M.P.H.
Key findings
Data from the National Health and Nutrition Examination Survey, 1976–1980, 1988–1994, 2001–2004, and 2007–2010For adults aged 40–74:
- The prevalence of high low-density lipoprotein cholesterol, or LDL–C, decreased from 59% to 27% from the late 1970s through 2007–2010.
- The percentage of adults using cholesterol-lowering medication increased from 5% to 23% from the late 1980s through 2007–2010.
- The percentage of adults consuming a diet low in saturated fat increased from 25% to 41% from the late 1970s through 1988–1994.
- No significant changes in the percentage of adults consuming a diet low in saturated fat were observed from 1988–1994 through 2007–2010.
Keywords: diet, adults, National Health and Nutrition Examination Survey
The prevalence of high LDL–C decreased from 1976–1980 to 2007–2010.
- Overall, the prevalence of high LDL–C significantly decreased from 59% in 1976–1980 to 42% in 1988–1994, and to 33% in 2001–2004, reaching 27% in 2007–2010.
- Between 1976–1980 and 2007–2010, the prevalence of high LDL–C significantly decreased for men (65% to 31%), women (54% to 24%), and adults aged 40–64 (56% to 27%) and 65–74 (72% to 30%) (Figure 1).
Figure 1. Age-adjusted prevalence of high LDL cholesterol among adults aged 40–74, by sex and age: United States, 1976–1980 to 2007–2010
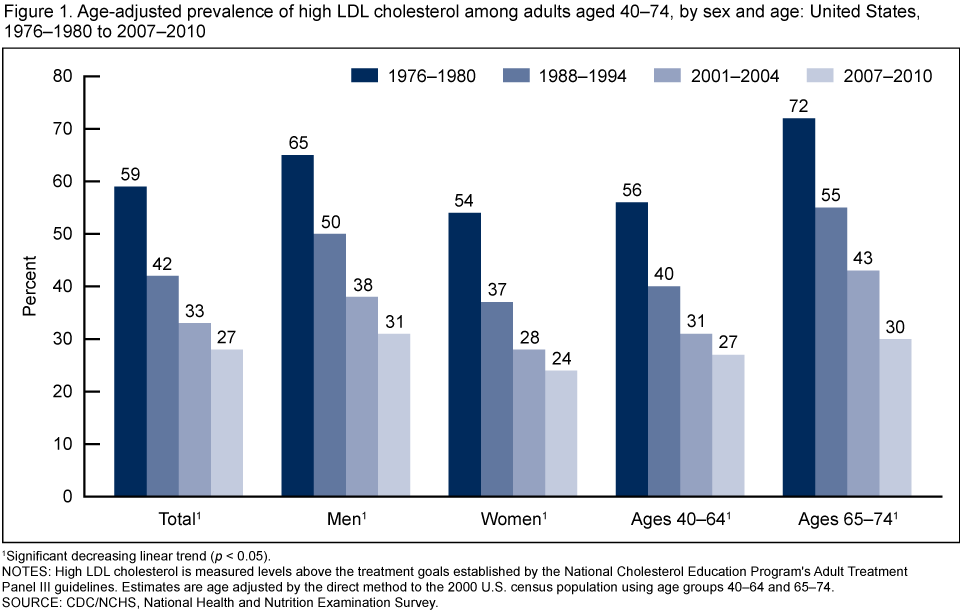
1Significant decreasing linear trend (p < 0.05).
NOTES: High LDL cholesterol is measured levels above the treatment goals established by the National Cholesterol Education Program's Adult Treatment Panel III guidelines. Estimates are age adjusted by the direct method to the 2000 U.S. census population using age groups 40–64 and 65–74.
SOURCE: CDC/NCHS, National Health and Nutrition Examination Survey.
The use of cholesterol-lowering medications increased from 1976–1980 through 2007–2010.
- No data on cholesterol-lowering medications were collected in the 1976–1980 study cycle. However, other data sources indicate that less than 1% of the population used lipid-lowering medication during the 1976–1980 time frame (5).
- The use of cholesterol-lowering medication grew from 5% in 1988–1994 to 17% in 2001–2004, and reached 23% in 2007–2010 (Figure 2).
- From 1988–1994 through 2007–2010, the use of cholesterol-lowering medication significantly increased for men (5% to 25%), women (6% to 21%), and adults aged 40–64 (4% to 19%) and 65–74 (10% to 39%).
Figure 2. Use of cholesterol-lowering medications among adults aged 40–74 (age adjusted): United States, 1988–1994 to 2007–2010
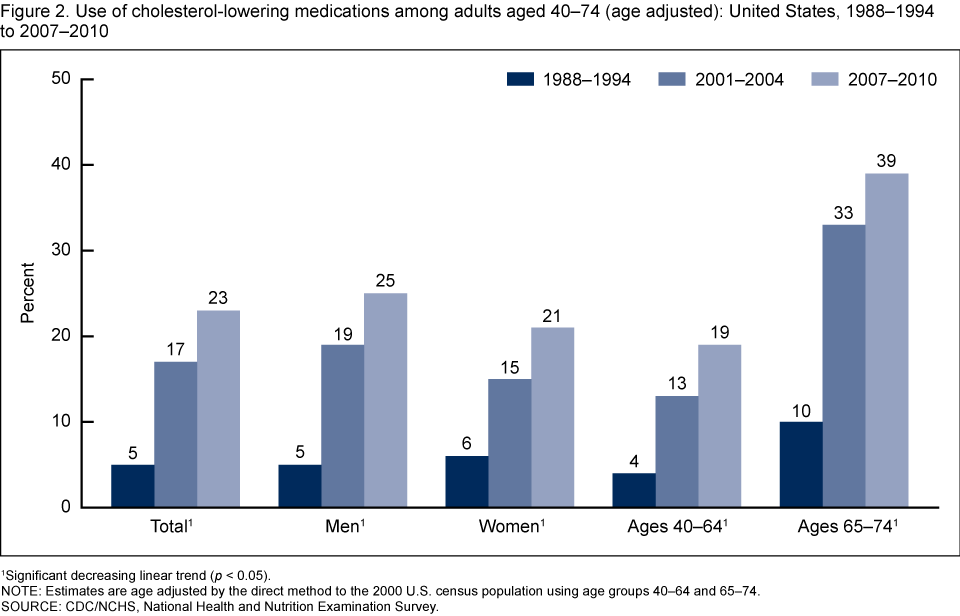
1Significant decreasing linear trend (p < 0.05).
NOTE: Estimates are age adjusted by the direct method to the 2000 U.S. census population using age groups 40–64 and 65–74.
SOURCE: CDC/NCHS, National Health and Nutrition Examination Survey.
NOTE: Estimates are age adjusted by the direct method to the 2000 U.S. census population using age groups 40–64 and 65–74.
SOURCE: CDC/NCHS, National Health and Nutrition Examination Survey.
An increased percentage of adults met guidelines for low saturated-fat intake from 1976–1980 to 1988–1994, but the percentage remained unchanged from 1988–1994 through 2007–2010.
- The percentage of adults meeting guidelines for low saturated-fat intake increased significantly from 1976–1980 to 1988–1994, from 25% to 41%, but no significant change occurred from 1988–1994 through 2007–2010 (Figure 3).
- Between 1988–1994 and 2007–2010, the percentage of adults consuming a diet low in saturated fat did not change significantly for men, women, and age groups 40–64 and 65–74.
Figure 3. Percentage of adults aged 40–74 meeting guidelines for low saturated-fat intake (age adjusted): United States, 1976–1980 to 2007–2010
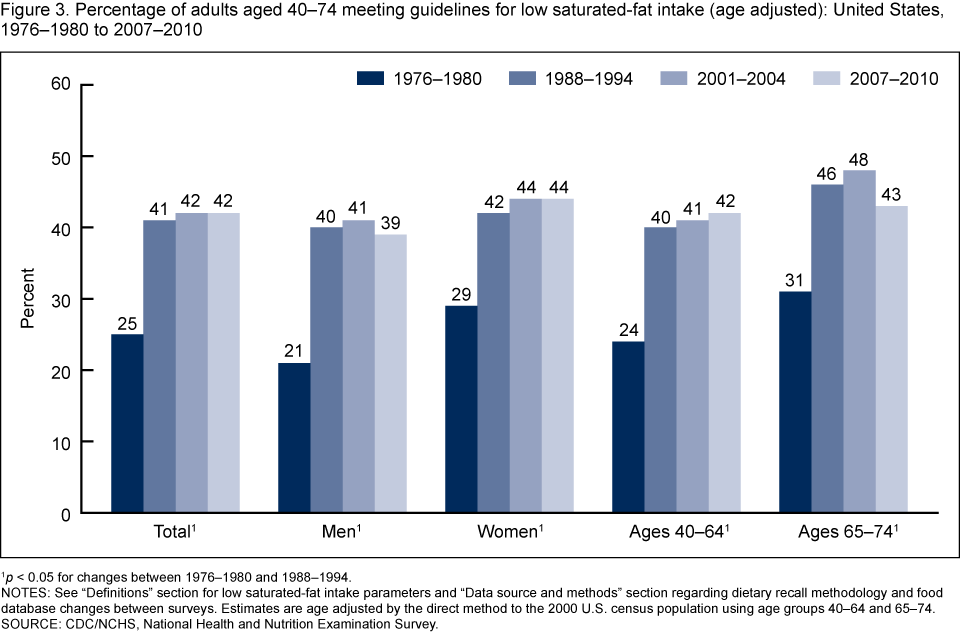
1p < 0.05 for changes between 1976–1980 and 1988–1994.
NOTES: See “Definitions” section for low saturated-fat intake parameters and “Data source and methods” section regarding dietary recall methodology and food database changes between surveys. Estimates are age adjusted by the direct method to the 2000 U.S. census population using age groups 40–64 and 65–74.
SOURCE: CDC/NCHS, National Health and Nutrition Examination Survey.
Trends are apparent in the prevalence of high LDL–C levels, medication use, and dietary intake of low saturated fat.
When high LDL–C, cholesterol-lowering medication use, and low saturated-fat intake during the time frame of 1976–1980 through 2007–2010 are presented together, the following patterns can be seen (Figure 4):
- Among U.S. adults aged 40–74, a substantial decline in the prevalence of high LDL–C, from 59% to 27%, was observed between 1976–1980 and 2007–2010.
- Significant increases are found in the percentage of adults with low dietary saturated-fat intake, from 25% to 41%, between 1976–1980 and 2007–2010. However, no significant changes were observed from 1988–1994 to 2007–2010. These changes were consistent among all population subgroups defined by sex and age (Figure 3).
- In contrast, use of cholesterol-lowering medication continued to grow steadily, from 5% to 23%, between 1988–1994 and 2007–2010.
Figure 4. Age-adjusted trends in prevalence of high LDL cholesterol, use of cholesterol-lowering medications, and low saturated-fat intake among adults aged 40–74: United States, 1976–1980 to 2007–2010
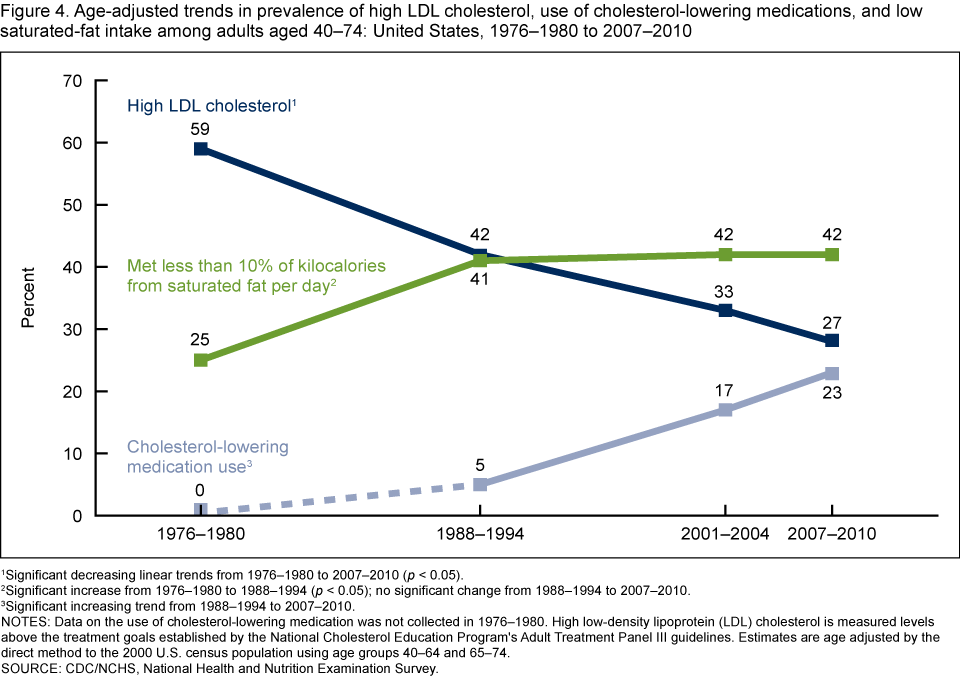
1Significant decreasing linear trends from 1976–1980 to 2007–2010 (p < 0.05).
2Significant increase from 1976–1980 to 1988–1994 (p < 0.05); no significant change from 1988–1994 to 2007–2010.
3Significant increasing trend from 1988–1994 to 2007–2010.
NOTES: Data on the use of cholesterol-lowering medication was not collected in 1976–1980. High low-density lipoprotein (LDL) cholesterol is measured levels above the treatment goals established by the National Cholesterol Education Program's Adult Treatment Panel III guidelines. Estimates are age adjusted by the direct method to the 2000 U.S. census population using age groups 40–64 and 65–74.
SOURCE: CDC/NCHS, National Health and Nutrition Examination Survey.
Summary
From 1976–1980 through 2007–2010, for U.S. adults aged 40–74, a decrease was observed in the prevalence of high LDL–C, as well as an increase in adults using lipid-lowering medications and consuming a diet low in saturated fat. A substantial decline in the prevalence of high LDL–C from 59% to 28% was seen over this same time period. There also were significant increases in the percentage of adults meeting federal dietary guidelines (6) for low dietary saturated-fat intake, from 25% to 42%, between 1976–1980 and 2007–2010; however, no significant changes were observed from 1988–1994 to 2007–2010. Although declines in the proportion of calories from saturated fat have occurred since the 1970s, the average dietary energy intake has increased (7). Use of cholesterol-lowering medication continued to grow steadily, from 5% to 23%, from 1988–1994 to 2007–2010.Despite recent advances in medical treatment, high cholesterol remains a significant public health problem in the United States, with more than one-quarter of adults aged 40–74 having high LDL–C. These findings may provide useful information for evaluation of programs and policy initiatives aimed at reducing the prevalence of high cholesterol in the adult population.
Definitions
Note: For all definitions listed, the denominator is total population.High LDL cholesterol (LDL–C): Measured levels of LDL–C above the treatment goals established by the National Cholesterol Education Program's Adult Treatment Panel (ATP) III guidelines: less than 160 milligrams per deciliter (mg/dL) for low-risk groups, less than 130 mg/dL for intermediate-risk groups, and less than 100 mg/dL for high-risk groups (3). Persons defined as having high LDL–C may or may not have been taking medication.
Use of cholesterol-lowering medication: Interviewed participants were identified as current users of cholesterol-lowering medication if they answered "yes" to the question: "To lower your blood cholesterol, are you now following this advice to take prescribed medicine?" Note that data on the use of cholesterol-lowering medication are not available for the second National Health and Nutrition Examination Survey (NHANES II), 1976–1980.
Low saturated-fat intake: Meeting ATP guidelines for consumption of less than 10% of total kilocalories from saturated fat (6), specifically the 24-hour period prior to the dietary recall interview (midnight to midnight), where total kilocalorie intake includes kilocalories from protein, carbohydrate, total fat, and alcohol. Standard conversion factors were used to convert grams of saturated fat to kilocalories: 9 kilocalories per gram. The percentage of kilocalories from saturated fat was then calculated by dividing the caloric intake from saturated fat by the total daily caloric intake, and multiplying this fraction by 100.
Data source and methods
Data from NHANES conducted during four study cycles—1976–1980, 1988–1994, 2001–2004, and 2007–2010—for adults aged 40–74 were used in this report. NHANES is a cross-sectional survey designed to monitor the health and nutritional status of the civilian noninstitutionalized U.S. population. The survey consists of interviews conducted in participants' homes and standardized physical examinations in mobile examination centers (MECs), including laboratory tests. One-half of participants aged 12 and over who participated in the MEC exam were randomly assigned to the morning sample and instructed to fast for at least 8 hours up to 24 hours prior to venipuncture. The prevalences of high LDL–C are based on persons examined in the morning and fasting for 8.5 up to 24 hours prior to venipuncture. The dietary saturated-fat data for this report were collected from in-person, 24-hour dietary recall interviews in the MEC. Dietary recalls cover intake during the day (24 hours) prior to the standardized physical examination at the MEC. Improvement in dietary intake methodology and food composition databases, as well as changes in food composition, occurred during the time frame of 1976–1980 through 2007–2010 (7).All variances were estimated by Taylor series linearization. Prevalence estimates were age adjusted by the direct method to the 2000 U.S. census population using the age groups 40–59 and 60–74. The following sample weights were incorporated in prevalence estimates and standard errors: fasting subsample weights for high LDL–C; interview weights for cholesterol medication use; MEC weights for saturated-fat intake estimates for 1976–1980 and 1988–1994; and dietary day-one weights for 2001–2004 and 2007–2010. Differences between groups were tested using a t statistic with the appropriate number of degrees of freedom at the p < 0.05 significance level. Adjustments were not made for multiple comparisons. Statistical hypotheses of no linear trends were tested using orthogonal contrasts matrices. Statistical analyses were conducted using SAS release 9.3 (SAS Institute, Cary, N.C.) and SUDAAN release 10.0 (RTI International, Research Triangle Park, N.C.).
About the authors
Elena V. Kuklina and Kate M. Shaw are with the Centers for Disease Control and Prevention's (CDC) National Center for Chronic Disease and Health Promotion, Division for Heart Disease and Stroke Prevention.Margaret D. Carroll and Rosemarie Hirsch are with CDC's National Center for Health Statistics, Division of Health and Nutrition Examination Surveys.
References
- Roger VL, Go AS, Lloyd-Jones DM, Benjamin EJ, Berry JD, Borden WB, et al. Executive summary: Heart disease and stroke statistics—2012 update: A report from the American Heart Association. Circulation 125(1):188–97. 2012.
- Cholesterol Treatment Trialists' (CTT) Collaboration, Baigent C, Blackwell L, Emberson J, Holland LE, Reith C, et al. Efficacy and safety of more intensive lowering of LDL cholesterol: A meta-analysis of data from 170,000 participants in 26 randomised trials. Lancet 376(9753):1670–81. 2010.
- National Institutes of Health, National Heart, Lung, and Blood Institute, National Cholesterol Education Program. Third report of the Expert Panel on Detection, Evaluation, and Treatment of High Blood Cholesterol in Adults (Adult Treatment Panel III)
. Bethesda, MD: National Institutes of Health. 2002.
- Kelly RB. Diet and exercise in the management of hyperlipidemia. Am Fam Physician 81(9):1097–102. 2010.
- National Center for Health Statistics, National Heart, Lung, and Blood Institute Collaborative Lipid Group. Trends in serum cholesterol levels among US adults aged 20 to 74 years. JAMA 257(7):937–42. 1987.
- U.S. Department of Agriculture, U.S. Department of Health and Human Services. Dietary guidelines for Americans, 2010. 7th ed. Washington, DC: U.S. Government Printing Office. 2010.
- Briefel RR, Johnson CL. Secular trends in dietary intake in the United States. Annu Rev Nutr 24:401–31. 2004.
Suggested citation
Kuklina EV, Carroll MD, Shaw KM, Hirsch R. Trends in high LDL cholesterol, cholesterol-lowering medication use, and dietary saturated-fat intake: United States, 1976–2010. NCHS data brief, no 117. Hyattsville, MD: National Center for Health Statistics. 2013.Copyright information
All material appearing in this report is in the public domain and may be reproduced or copied without permission; citation as to source, however, is appreciated.National Center for Health Statistics
Edward J. Sondik, Ph.D., DirectorJennifer H. Madans, Ph.D., Associate Director for Science


.png)


No hay comentarios:
Publicar un comentario