05/06/2016 03:52 PM EDT
Source: National Center for Health Statistics
Related MedlinePlus Page: Obesity
Related MedlinePlus Page: Obesity
Prevalence of Obesity Among Adults and Youth: United States, 2011–2014
NCHS Data Brief No. 219, November 2015PDF Version (704 KB)
Cynthia L. Ogden, Ph.D.; Margaret D. Carroll, M.S.P.H.; Cheryl D. Fryar, M.S.P.H.; and Katherine M. Flegal, Ph.D.
Key findings
Data from the National Health and Nutrition Examination Survey
- In 2011–2014, the prevalence of obesity was just over 36% in adults and 17% in youth.
- The prevalence of obesity was higher in women (38.3%) than in men (34.3%). Among all youth, no difference was seen by sex.
- The prevalence of obesity was higher among middle-aged (40.2%) and older (37.0%) adults than younger (32.3%) adults.
- The prevalence of obesity was higher among non-Hispanic white, non-Hispanic black, and Hispanic adults and youth than among non-Hispanic Asian adults and youth.
- From 1999 through 2014, obesity prevalence increased among adults and youth. However, among youth, prevalence did not change from 2003–2004 through 2013–2014.
Obesity is associated with health risks (1,2). Monitoring the prevalence of obesity is relevant for public health programs that focus on reducing or preventing obesity. No significant changes were seen in either adult or childhood obesity prevalence in the United States between 2003–2004 and 2011–2012 (3). This report provides the most recent national data on obesity prevalence by sex, age, and race and Hispanic origin, using data for 2011–2014. Overall prevalence estimates from 1999–2000 through 2013–2014 are also presented.
Keyword: National Health and Nutrition Examination Survey
What was the prevalence of obesity among adults in 2011–2014?
The prevalence of obesity was 36.5% (crude estimate) among U.S. adults during 2011–2014. Overall, the prevalence of obesity among middle-aged adults aged 40–59 (40.2%) and older adults aged 60 and over (37.0%) was higher than among younger adults aged 20–39 (32.3%). No significant difference in prevalence was observed between middle-aged and older adults (Figure 1).
Overall, the prevalence of obesity among women (38.3%) was higher than among men (34.3%). For adults aged 20–39 and 40–59, the prevalence of obesity was higher among women than among men, but the difference between older women and men aged 60 and over was not significant.
Among both men and women, the prevalence of obesity followed a similar pattern by age. Men aged 40–59 (38.3%) had a higher prevalence of obesity than men aged 20–39 (30.3%). Women aged 40–59 (42.1%) had a higher prevalence of obesity than women aged 20–39 (34.4%). The prevalence of obesity among men and women aged 20–39 was lower than among men and women aged 60 and over, except the difference for men was not significant.
Figure 1. Prevalence of obesity among adults aged 20 and over, by sex and age: United States, 2011–2014
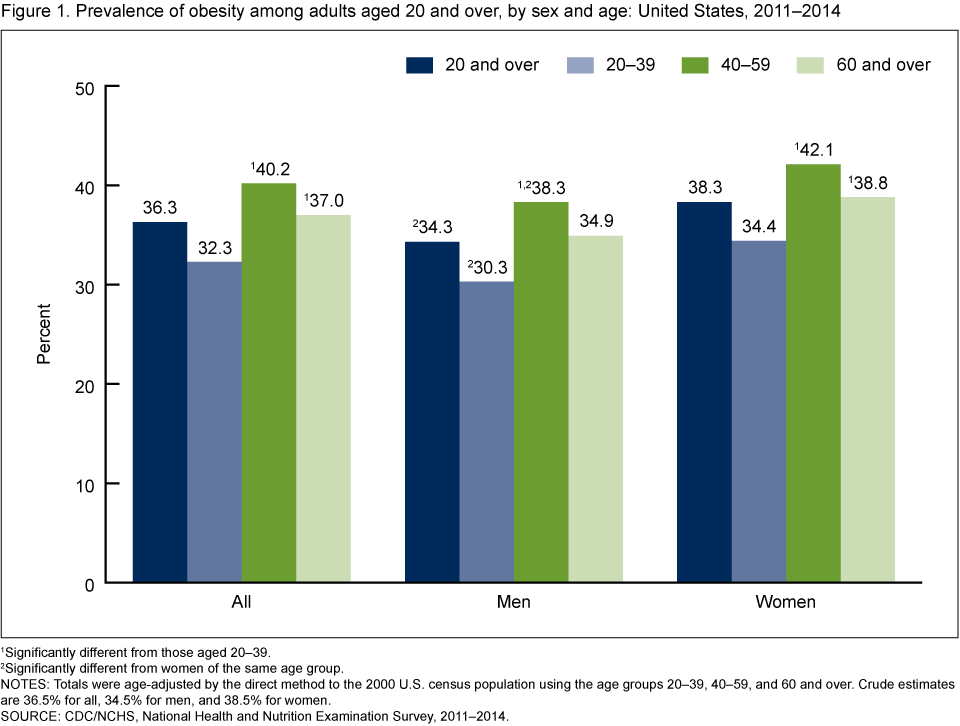
1Significantly different from those aged 20–39.
2Significantly different from women of the same age group.
NOTES: Totals were age-adjusted by the direct method to the 2000 U.S. census population using the age groups 20–39, 40–59, and 60 and over. Crude estimates are 36.5% for all, 34.5% for men, and 38.5% for women.
SOURCE: CDC/NCHS, National Health and Nutrition Examination Survey, 2011–2014.
Were there differences in the prevalence of obesity among adults by race and Hispanic origin in 2011–2014?
The prevalence of obesity was lowest among non-Hispanic Asian adults (11.7%), followed by non-Hispanic white (34.5%), Hispanic (42.5%), and non-Hispanic black (48.1%) adults. All differences were significant. The pattern among women was similar to the pattern in the overall adult population. The prevalence of obesity was 11.9% in non-Hispanic Asian, 35.5% in non-Hispanic white, 45.7% in Hispanic, and 56.9% in non-Hispanic black women. The prevalence of obesity was lower in non-Hispanic Asian (11.2%) men compared with non-Hispanic white (33.6%), non-Hispanic black (37.5%), and Hispanic (39.0%) men. No difference in obesity prevalence was observed between non-Hispanic black and non-Hispanic white men, nor was there a difference between non-Hispanic black and Hispanic men (Figure 2).
The only differences by sex were found among non-Hispanic black and Hispanic adults. The prevalence of obesity among non-Hispanic black women was 56.9% compared with 37.5% in non-Hispanic black men. The prevalence of obesity was 45.7% among Hispanic women compared with 39.0% in Hispanic men.
Figure 2. Prevalence of obesity among adults aged 20 and over, by sex and race and Hispanic origin: United States, 2011–2014
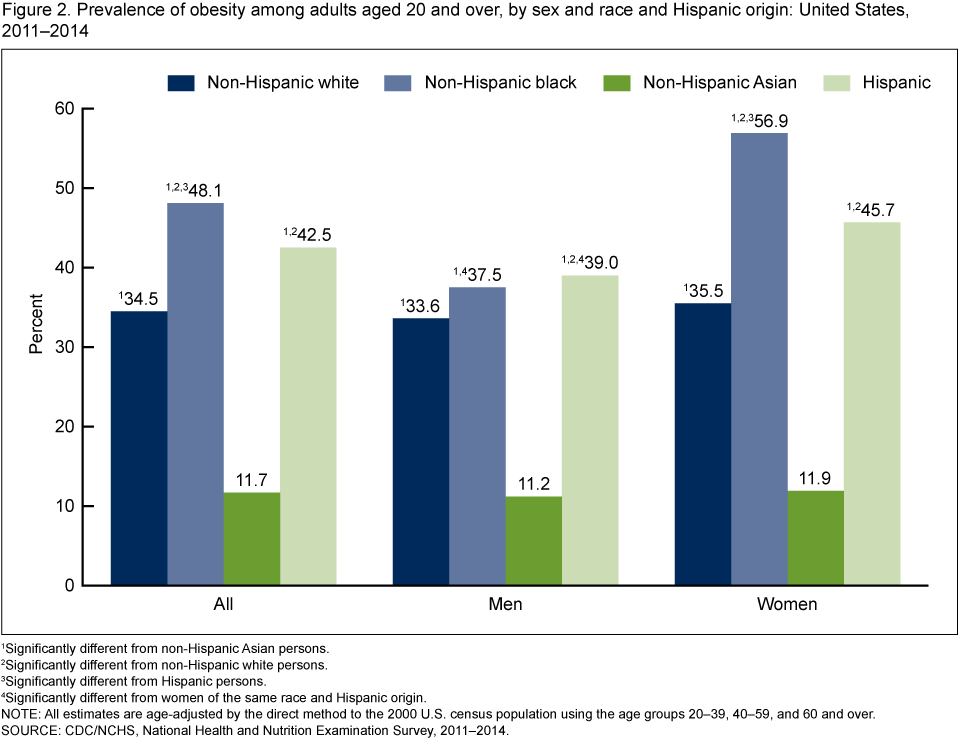
1Significantly different from non-Hispanic Asian persons.
2Significantly different from non-Hispanic white persons.
3Significantly different from Hispanic persons.
4Significantly different from women of the same race and Hispanic origin.
NOTE: All estimates are age-adjusted by the direct method to the 2000 U.S. census population using the age groups 20–39, 40–59, and 60 and over.
SOURCE: CDC/NCHS, National Health and Nutrition Examination Survey, 2011–2014.
What was the prevalence of obesity among youth aged 2–19 years in 2011–2014?
The prevalence of obesity among U.S. youth was 17.0% in 2011–2014. Overall, the prevalence of obesity among preschool-aged children (2–5 years) (8.9%) was lower than among school-aged children (6–11 years) (17.5%) and adolescents (12–19 years) (20.5%). The same pattern was seen in both males and females (Figure 3).
Figure 3. Prevalence of obesity among youth aged 2–19 years, by sex and age: United States, 2011–2014
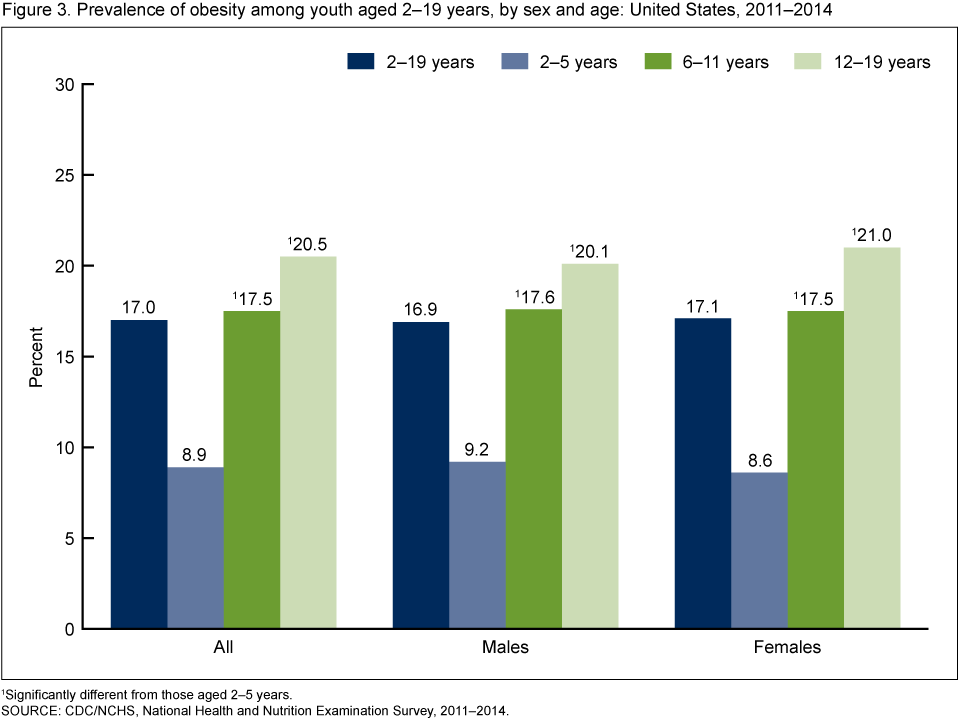
1Significantly different from those aged 2–5 years.
SOURCE: CDC/NCHS, National Health and Nutrition Examination Survey, 2011–2014.
SOURCE: CDC/NCHS, National Health and Nutrition Examination Survey, 2011–2014.
Were there differences in the prevalence of obesity among youth aged 2–19 years by race and Hispanic origin in 2011–2014?
The prevalence of obesity among non-Hispanic Asian youth (8.6%) was lower than among non-Hispanic white (14.7%), non-Hispanic black (19.5%), and Hispanic (21.9%) youth. The prevalence of obesity among non-Hispanic white youth was lower than in non-Hispanic black and Hispanic youth, but no significant difference was observed between non-Hispanic black and Hispanic youth.
The pattern among females was similar to the pattern in the overall population, except the prevalence was not significantly different in non-Hispanic white females compared with non-Hispanic black females. The prevalence of obesity was 5.3% in non-Hispanic Asian, 15.1% in non-Hispanic white, 20.7% in non-Hispanic black, and 21.4% in Hispanic females.
Among males, the prevalence of obesity was lower in non-Hispanic Asian (11.8%) males compared with non-Hispanic black (18.4%) and Hispanic (22.4%) males, but no significant difference was seen between non-Hispanic Asian (11.8%) and non-Hispanic white (14.3%) males. Differences between non-Hispanic white, non-Hispanic black, and Hispanic males were statistically significant (Figure 4).
The only difference by sex was found among non-Hispanic Asian youth—the prevalence was 11.8% in non-Hispanic Asian males and 5.3% in non-Hispanic Asian females.
Figure 4. Prevalence of obesity among youth aged 2–19 years, by sex and race and Hispanic origin: United States, 2011–2014
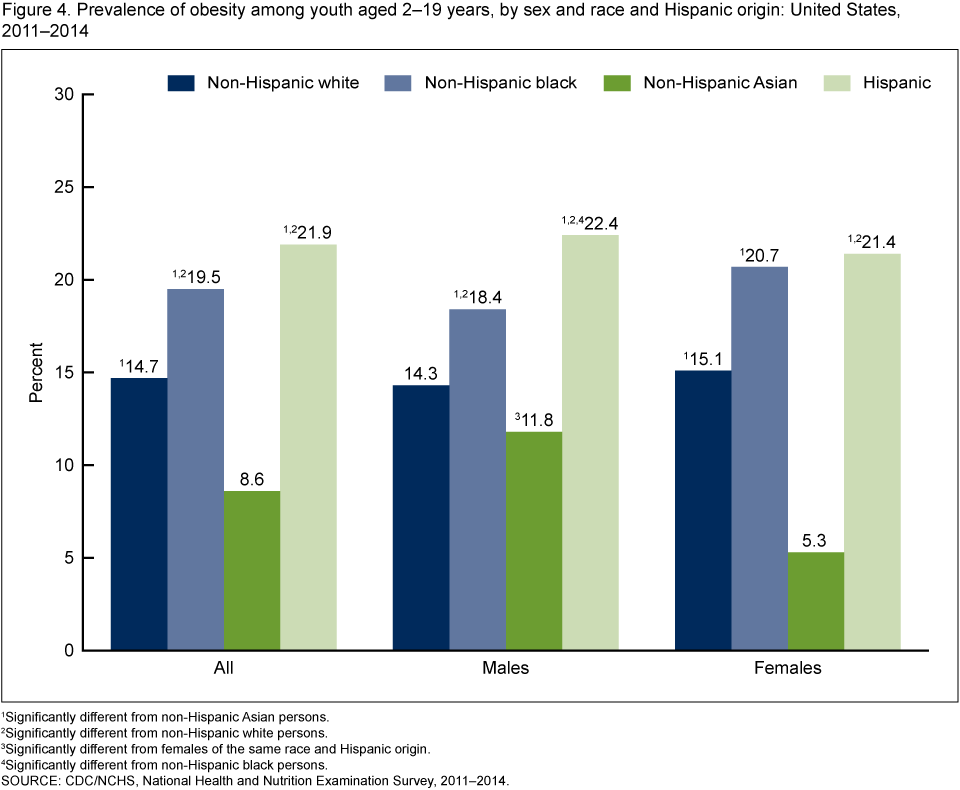
1Significantly different from non-Hispanic Asian persons.
2Significantly different from non-Hispanic white persons.
3Significantly different from females of the same race and Hispanic origin.
4Significantly different from non-Hispanic black persons.
SOURCE: CDC/NCHS, National Health and Nutrition Examination Survey, 2011–2014.
2Significantly different from non-Hispanic white persons.
3Significantly different from females of the same race and Hispanic origin.
4Significantly different from non-Hispanic black persons.
SOURCE: CDC/NCHS, National Health and Nutrition Examination Survey, 2011–2014.
What are the trends in adult and childhood obesity?
From 1999–2000 through 2013–2014, a significant increase in obesity was observed in both adults and youth. Between 2003–2004 and 2013–2014, however, no change in prevalence was seen among youth. No change in obesity prevalence among youth was noted between 2011–2012 and 2013–2014, and the observed change in adults between 2011–2012 and 2013–2014 was not significant (Figure 5).
Figure 5. Trends in obesity prevalence among adults aged 20 and over (age-adjusted) and youth aged 2–19 years: United States, 1999–2000 through 2013–2014

1Significant increasing linear trend from 1999–2000 through 2013–2014.
2Test for linear trend for 2003–2004 through 2013–2014 not significant (p > 0.05).
NOTE: All adult estimates are age-adjusted by the direct method to the 2000 U.S. census population using the age groups 20–39, 40–59, and 60 and over.
SOURCE: CDC/NCHS, National Health and Nutrition Examination Survey.
Summary
More than one-third of adults and 17% of youth in the United States were obese in 2011–2014. The prevalence of obesity was higher among women than among men overall and higher among non-Hispanic black and Hispanic adults compared with other racial and Hispanic origin groups. Among youth, no difference in obesity prevalence was seen between males and females, except among non-Hispanic Asian youth.
Obesity prevalence was lower among non-Hispanic Asian adults compared with other racial and Hispanic origin groups. No difference in obesity prevalence was observed between non-Hispanic black and Hispanic men. However, the prevalence was higher among non-Hispanic black women compared with Hispanic women. Among youth, the prevalence of obesity was lowest among non-Hispanic Asian youth, but no significant difference in prevalence was seen between non-Hispanic white and non-Hispanic Asian males. Among males, the prevalence of obesity was lower among non-Hispanic black compared with Hispanic youth. However, among females, no difference in prevalence was observed between non-Hispanic black and Hispanic youth.
Trends in obesity prevalence show no increase among youth since 2003–2004, but trends do show increases in both adults and youth from 1999–2000 through 2013–2014. No significant differences between 2011–2012 and 2013–2014 were seen in either youth or adults.
Obesity is defined using cut points of body mass index (BMI). BMI does not measure body fat directly, and the relationship between BMI and body fat varies by sex, age, and race and Hispanic origin (4,5). Morbidity and mortality risk may vary between different racial and Hispanic origin groups at the same BMI. Some studies suggest that among some Asian subgroups, health and mortality risks may begin at a lower BMI compared with other racial and Hispanic origin groups (6–8).
The definition of obesity is based on BMI for both youth and adults, but the definitions are not directly comparable. Among adults, there is a set cut point based on health risk, while among children the definition is statistical and is based on a comparison to a reference population (9).
The prevalence of obesity among U.S. adults remains higher than the Healthy People 2020 goal of 30.5% (10). Although the overall prevalence of childhood obesity is higher than the Healthy People 2020 goal of 14.5%, the prevalence of obesity among children aged 2–5 years is below the goal of 9.4%.
Definitions
Non-Hispanic Asian: Primarily comprises persons of Chinese, Asian Indian, Korean, Filipino, Vietnamese, and Japanese descent.
Obesity: BMI was calculated as weight in kilograms divided by height in meters squared, rounded to one decimal place. Obesity in adults was defined as a BMI of greater than or equal to 30. Obesity in youth was defined as a BMI of greater than or equal to the age- and sex-specific 95th percentile of the 2000 CDC growth charts (9).
Data source and methods
Data from the National Health and Nutrition Examination Surveys (NHANES) for survey years 1999–2000, 2001–2002, 2003–2004, 2005–2006, 2007–2008, 2009–2010, 2011–2012, and 2013–2014 were used for these analyses. Data from NHANES 2011–2014 (4 years of data) were used to test differences between demographic subgroups, thus increasing the sample size and the ability to detect a difference in the prevalence. In testing for trends in obesity, eight 2-year cycles were used: 1999–2000, 2001–2002, 2003–2004, 2005–2006, 2007–2008, 2009–2010, 2011–2012, and 2013–2014. Because previous research found no increase in obesity prevalence from 2003–2004 through 2011–2012 (3), analyses of linear trends were also conducted between 2003–2004 and 2013–2014.
NHANES is a cross-sectional survey designed to monitor the health and nutritional status of the civilian noninstitutionalized U.S. population (11). The survey consists of interviews conducted in participants’ homes and standardized physical examinations conducted in mobile examination centers.
The NHANES sample is selected through a complex, multistage probability design. In 2011–2012 and 2013–2014, non-Hispanic black, non-Hispanic Asian, and Hispanic persons, among other groups, were oversampled to obtain reliable estimates for these population subgroups. Race- and Hispanic origin-specific estimates reflect individuals reporting only one race; those reporting more than one race are included in the total but are not reported separately.
Examination sample weights, which account for the differential probabilities of selection, nonresponse, and noncoverage, were incorporated into the estimation process. All variance estimates accounted for the complex survey design by using Taylor series linearization. Pregnant females were excluded from analyses.
Prevalence estimates for the adult population aged 20 and over were age-adjusted using the direct method to the 2000 U.S. census population using the age groups 20–39, 40–59, and 60 and over. Differences between groups were tested using a univariate t statistic at the p < 0.05 significance level. All differences reported are statistically significant unless otherwise indicated. Adjustments were not made for multiple comparisons. Statistical analyses were conducted using the SAS System for Windows, release 9.3 (SAS Institute Inc., Cary, N.C.) and SUDAAN, release 11.1 (RTI International, Research Triangle Park, N.C.).
About the authors
Cynthia L. Ogden, Margaret D. Carroll, Cheryl D. Fryar, and Katherine M. Flegal are with CDC’s National Center for Health Statistics, Division of Health and Nutrition Examination Surveys.
References
- Clinical guidelines on the identification, evaluation, and treatment of overweight and obesity in adults—The evidence report. Obes Res 6 Suppl 2:51S–209S. 1998.
- U.S. Department of Health and Human Services, Office of the Surgeon General. The surgeon general’s vision for a healthy and fit nation. Rockville, MD: 2010.
- Ogden CL, Carroll MD, Kit BK, Flegal KM. Prevalence of childhood and adult obesity in the United States, 2011–2012. JAMA 311(8):806–14. 2014.
- Flegal KM, Ogden CL, Yanovski JA, Freedman DS, Shepherd JA, Graubard BI, Borrud LG. High adiposity and high body mass index-for-age in US children and adolescents overall and by race-ethnic group. Am J Clin Nutr 91(4):1020–6. 2010.
- Deurenberg P, Deurenberg-Yap M, Guricci S. Asians are different from Caucasians and from each other in their body mass index/body fat per cent relationship. Obes Rev 3(3):141–6. 2002.
- Nguyen TT, Adair LS, Suchindran CM, He K, Popkin BM. The association between body mass index and hypertension is different between East and Southeast Asians. Am J Clin Nutr 89(6):1905–12. 2009.
- Jafar TH, Islam M, Poulter N, Hatcher J, Schmid CH, Levey AS, Chaturvedi N. Children in South Asia have higher body mass-adjusted blood pressure levels than white children in the United States: A comparative study. Circulation 111(10):1291–7. 2005.
- Zheng W, McLerran DF, Rolland B, Zhang X, Inoue M, Matsuo K, et al. Association between body-mass index and risk of death in more than 1 million Asians. N Engl J Med 364(8):719–29. 2011.
- Ogden CL, Flegal KM. Changes in terminology for childhood overweight and obesity. National health statistics reports; no 25. Hyattsville, MD: National Center for Health Statistics. 2010.
- U.S. Department of Health and Human Services, Office of Disease Prevention and Health Promotion. Healthy People 2020 topics and objectives: Nutrition and weight status. Washington, DC.
- Johnson CL, Dohrmann SM, Burt VL, Mohadjer LK. National Health and Nutrition Examination Survey: Sample design, 2011–2014. National Center for Health Statistics. Vital Health Stat 2(162). 2014.
Suggested citation
Ogden CL, Carroll MD, Fryar CD, Flegal KM. Prevalence of obesity among adults and youth: United States, 2011–2014. NCHS data brief, no 219. Hyattsville, MD: National Center for Health Statistics. 2015.
Copyright information
All material appearing in this report is in the public domain and may be reproduced or copied without permission; citation as to source, however, is appreciated.
National Center for Health Statistics
Charles J. Rothwell, M.S., M.B.A., Director
Nathaniel Schenker, Ph.D., Deputy Director
Jennifer H. Madans, Ph.D., Associate Director for Science
Nathaniel Schenker, Ph.D., Deputy Director
Jennifer H. Madans, Ph.D., Associate Director for Science
Division of Health and Nutrition Examination Surveys
Kathryn S. Porter, M.D., M.S., Director
Ryne Paulose-Ram, Ph.D., Associate Director for Science
Ryne Paulose-Ram, Ph.D., Associate Director for Science


No hay comentarios:
Publicar un comentario