 |
| MMWR Weekly Vol. 65, No. 37 September 23, 2016 |
| PDF of this issue |
Update: Influenza Activity — United States and Worldwide, May 22–September 10, 2016
Weekly / September 23, 2016 / 65(37);1008–1014
Alicia Budd, MPH1; Lenee Blanton, MPH1; Krista Kniss, MPH1; Sophie Smith, MPH1; Desiree Mustaquim, MPH1; Stacy L. Davlin, PhD1; Natalie Kramer1; Brendan Flannery, PhD1; Alicia M. Fry, MD1; Lisa A. Grohskopf, MD1; Sonja J. Olsen, PhD1; Joseph Bresee, MD1; Wendy Sessions, MPH1; Rebecca Garten, PhD1; Xiyan Xu, MD1; Anwar Isa Abd Elal1; Larisa Gubareva, PhD1; John Barnes, PhD1; David E. Wentworth, PhD1; Erin Burns, MA1; Jacqueline Katz, PhD1; Daniel Jernigan, MD1; Lynnette Brammer, MPH1 (View author affiliations)
View suggested citationSummary
What is already known about this topic?CDC collects, compiles, and analyzes data on influenza activity year-round in the United States. The influenza season generally begins in the fall and continues through the winter and spring months; however, the timing and severity of disease and the predominant viral strains can vary by geographic location and season.
What is added by this report?Worldwide, influenza activity during May 22–September 10, 2016, followed typical seasonality. In the United States, low levels of seasonal influenza activity were detected overall. However, since late August, clinical laboratories have reported a slight increase in positive test results for influenza and CDC has received reports of a small number of localized influenza outbreaks caused by influenza A (H3N2) viruses.
What are the implications for public health practice?In the United States, an influenza vaccination is recommended for all persons aged ≥6 months, and can reduce the likelihood of becoming ill with influenza and transmitting the virus to others. Annual influenza vaccination is recommended for optimal protection. This season, CDC recommends use of the flu shot (inactivated influenza vaccine or IIV) or the recombinant influenza vaccine (RIV). The live attenuated intranasal vaccine (LAIV4) is not recommended for use during the 2016–2017 influenza season. Although vaccination is the best method for preventing and reducing the effects of influenza, antiviral medications are a valuable adjunct. Treatment with influenza antiviral medications is recommended as early as possible in the course of illness for patients with confirmed or suspected influenza (either seasonal influenza or novel influenza virus infection) who have severe, complicated, or progressive illness; who require hospitalization; or who are at high risk for influenza-related complications. Given recent reports of influenza outbreaks, it is important to consider the possibility of influenza virus infection in persons with influenza-like illness even though influenza activity overall remains low at this time.
Alicia Budd, MPH1; Lenee Blanton, MPH1; Krista Kniss, MPH1; Sophie Smith, MPH1; Desiree Mustaquim, MPH1; Stacy L. Davlin, PhD1; Natalie Kramer1; Brendan Flannery, PhD1; Alicia M. Fry, MD1; Lisa A. Grohskopf, MD1; Sonja J. Olsen, PhD1; Joseph Bresee, MD1; Wendy Sessions, MPH1; Rebecca Garten, PhD1; Xiyan Xu, MD1; Anwar Isa Abd Elal1; Larisa Gubareva, PhD1; John Barnes, PhD1; David E. Wentworth, PhD1; Erin Burns, MA1; Jacqueline Katz, PhD1; Daniel Jernigan, MD1; Lynnette Brammer, MPH1 (View author affiliations)
View suggested citationDuring May 22–September 10, 2016,* the United States experienced typical low levels of seasonal influenza activity overall; beginning in late August, clinical laboratories reported a slight increase in influenza positive test results and CDC received reports of a small number of localized influenza outbreaks caused by influenza A (H3N2) viruses. Influenza A (H1N1)pdm09, influenza A (H3N2), and influenza B viruses were detected during May–September in the United States and worldwide. The majority of the influenza viruses collected from the United States and other countries during that time have been characterized antigenically or genetically or both as being similar to the reference viruses representing vaccine components recommended for the 2016–17 Northern Hemisphere vaccine. During May 22–September 10, 2016, 20 influenza variant virus† infections were reported; two were influenza A (H1N2) variant (H1N2v) viruses (Minnesota and Wisconsin) and 18 were influenza A (H3N2) variant (H3N2v) viruses (12 from Michigan and six from Ohio).
United States
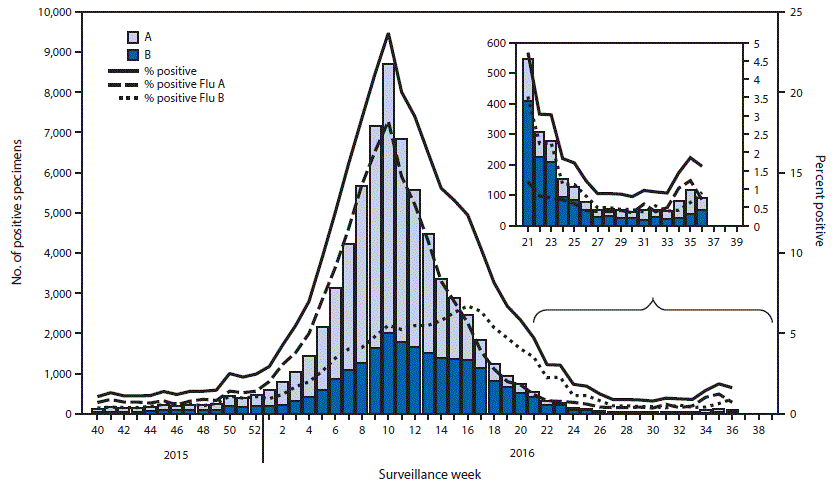
The U.S. influenza surveillance system§ is a collaboration between CDC and federal, state, local, and territorial partners and uses nine data sources to collect influenza information, seven of which operate year-round.¶ During May 22–September 10, 2016, laboratories participating in the U.S. World Health Organization (WHO) Collaborating Laboratories System (primarily public health laboratories) tested 5,365 specimens for influenza and 817 were positive for seasonal influenza viruses; 458 (56.1%) were influenza A viruses, and 359 (43.9%) were influenza B viruses (Figure 1). Influenza B viruses were reported more frequently than influenza A viruses during May–June. However, since the beginning of July, influenza A viruses were reported more frequently. Of the 448 influenza A viruses subtyped, 377 (84.2%) were influenza A (H3N2) viruses and 71 (15.8%) were influenza A (H1N1)pdm09 viruses. Lineage was determined for 249 influenza B viruses; 172 (69.1%) were B/Yamagata lineage and 77 (30.9%) were B/Victoria lineage. During the same period, laboratories participating in the National Respiratory and Enteric Virus Surveillance System (NREVSS) (primarily clinical laboratories) tested 110,230 specimens for influenza viruses (Figure 2); 2,126 (1.9%) were positive. Among the positive specimens, 763 (35.9%) were influenza A viruses and 1,363 (64.1%) were influenza B viruses. Influenza viruses were reported from Puerto Rico and 49 states in all 10 U.S. Department of Health and Human Services regions.**
During May 22–September 10, data from the U.S. Outpatient Influenza-Like Illness Surveillance Network (ILINet) indicated that the weekly percentage of outpatient visits to health care providers for influenza-like illness (ILI)†† remained below the national baseline§§ of 2.1% and ranged from 0.7% to 1.2%. Based on data from CDC’s National Center for Health Statistics Mortality Surveillance System and, as reported by the 122 Cities Mortality Reporting System,¶¶ the proportion of deaths attributed to pneumonia and influenza (P&I) remained below the epidemic threshold*** in both systems and ranged from 5.0% to 6.3% and 4.9% to 6.4% in each system, respectively. Five influenza-associated pediatric deaths occurring during May 22–September 10 were reported; three were associated with influenza B viruses and two were associated with influenza A viruses for which no subtyping was performed.
Novel Influenza A Virus Infection
During May 22–September 10, 20 cases of human infection with novel influenza A viruses were reported; two H1N2v virus infections and 18 H3N2v virus infections (reported in FluView weeks 25 and 31–34). The H1N2v viruses were reported by Minnesota (one infection that occurred in April) and Wisconsin (one infection that occurred in June). Both patients reported contact with swine in the week preceding illness onset and no ongoing community transmission of either virus was detected. One of the two patients (the Wisconsin case) was hospitalized because of the illness and both patients have recovered. The 18 H3N2v virus infections were reported by Michigan (12) and Ohio (six) and are the first reported human infections with H3N2v in the United States during 2016. All 18 H3N2v virus infections were reported in August among persons who had exposure to swine at one or more fairs in the week preceding their illness; the median age was 7 years. One of the 18 persons was hospitalized for H3N2v virus infection. Swine influenza A (H3N2) virus was identified from at least one respiratory sample collected from pigs at each of the associated fairs.
Worldwide
CDC serves as a WHO Collaborating Center for Surveillance, Epidemiology, and Control of Influenza, one of six WHO Collaborating Centers for Influenza in the WHO Global Influenza Surveillance and Response System (GISRS) (1). CDC, along with other international public health partners, provides surveillance and virus characterization data to WHO (2). The timing of influenza activity around the world varies by region††† and areas with similar influenza transmission patterns are grouped by influenza transmission zones (2).
During May 22–September 4, typical seasonal patterns of influenza activity occurred in temperate climate Southern Hemisphere countries. In Australia, influenza activity began increasing in mid-July and peaked in August, with influenza A (H3N2) viruses predominating. Activity in New Zealand remained low. In Southern Africa, influenza activity continued to increase during May–August. Influenza B viruses predominated until mid-July; subsequently influenza A (H3N2) viruses were reported more frequently than influenza B viruses. In temperate countries of South America, influenza activity began to increase in May, remained elevated in Chile throughout the period, but declined in Argentina, Paraguay, and Uruguay after peaking in June. Influenza A (H1N1)pdm09 viruses were reported more frequently than influenza B viruses in Argentina, Chile, and Paraguay; Uruguay reported only influenza A (H1N1)pdm 09 viruses. In temperate climate countries of Europe, North America, and Asia, influenza activity remained low, with influenza A (H1N1)pdm09, influenza A (H3N2), and influenza B viruses being reported.
In countries with tropical influenza seasonality, influenza activity levels and the predominant virus varied by country. In the Caribbean, activity was low and influenza B viruses were predominant. Influenza activity in eastern and western Africa remained low, with influenza A (H3N2), influenza A (H1N1)pdm09 and influenza B viruses circulating. In Central and tropical South America, influenza A (H1N1)pdm09 viruses were more commonly reported. Activity remained low throughout the period in Brazil, Costa Rica, and Peru, although in El Salvador, Panama, Colombia, Bolivia, and Ecuador, activity peaked in June and declined to low levels in August. In South Asia, activity was low, with influenza A and influenza B viruses co-circulating. Influenza activity in Southeast Asia began to increase during June and peaked in August. Influenza A (H1N1)pdm09, influenza A (H3N2), and influenza B viruses co-circulated in this region.
During May 9–September 10, WHO reported that 34 laboratory-confirmed human cases of avian influenza infection have occurred since March 23, 2016. Egypt reported four influenza A (H5N1) virus infections and China reported 30 human cases of avian influenza infection, including one influenza A (H5N6) infection, 28 influenza A (H7N9) infections, and one influenza A (H9N2) infection.§§§
Antigenic and Genetic Characterization of Influenza Viruses
The components for the 2016–17 Northern Hemisphere influenza vaccines were selected in February 2016, during the twice-yearly WHO-sponsored vaccine consultation meeting to review data generated by GISRS laboratories. The recommended Northern Hemisphere 2016–17 trivalent influenza vaccine composition includes an A/California/7/2009 (H1N1)pdm09-like virus, an A/Hong Kong/4801/2014 (H3N2)-like virus, and a B/Brisbane/60/2008-like (B/Victoria lineage) virus (3). An additional influenza B virus (B/Phuket/3073/2013-like [B/Yamagata lineage]) was recommended for quadrivalent vaccines (3). These are the same vaccine viruses that were recommended for inclusion in the 2016 Southern Hemisphere influenza vaccines. Influenza viruses used to produce most influenza vaccines in the United States are grown in eggs according to current regulatory requirements. However, egg propagation of influenza viruses, particularly influenza A (H3N2) viruses, can lead to genetic changes that might have antigenic implications. The vaccine viruses selected for the Northern Hemisphere 2016–17 vaccine were representative of most, but not all, circulating influenza viruses at that time, and had the fewest and least substantial egg-adapted changes.
Data obtained from antigenic characterization are important in the assessment of the similarity between reference vaccine viruses and circulating viruses. Although vaccine-effectiveness field studies must be conducted to determine how well a vaccine is working, laboratory data are used to evaluate whether changes in circulating wild-type viruses that could affect vaccine effectiveness might have occurred. Beginning with the 2014–15 season, a proportion of influenza A (H3N2) viruses have not yielded sufficient hemagglutination titers for antigenic characterization by the hemagglutination inhibition test. Therefore, CDC selects a subset of influenza A (H3N2) viruses to test using a neutralization focus reduction assay for supplementary antigenic characterization. For nearly all viruses characterized at CDC laboratories, next-generation whole genome sequencing is performed to determine the genetic identity of circulating viruses. For the subset of viruses that do not yield sufficient hemagglutination titers, antigenic properties are inferred using results obtained from viruses within the same genetic group as those that have been characterized antigenically.
CDC has antigenically or genetically characterized 504 influenza viruses collected and submitted by U.S. and international laboratories since May 1, 2016, including 134 influenza A (H1N1)pdm09 viruses, 134 influenza A (H3N2) viruses, and 236 influenza B viruses. Among the 134 influenza A (H1N1)pdm09 viruses characterized (98 international and 36 U.S.), all were antigenically similar to A/California/7/2009, the reference virus representing the influenza A (H1N1) component of the 2016–17 Northern Hemisphere influenza vaccine. All influenza A (H1N1)pdm09 viruses sequenced (91 international and 34 U.S.) belong to hemagglutinin genetic subgroup 6B, 6B.1, or 6B.2, with viruses in the 6B.1 genetic subgroup predominating.
A total of 134 influenza A (H3N2) viruses collected globally since May 1, 2016, were sequenced (59 international and 75 U.S.), and all viruses belonged to genetic subgroups 3C.2a or 3C.3a. A subset of 103 influenza A (H3N2) viruses was antigenically characterized (38 international and 65 U.S.); 86 of 103 (83.5%) were antigenically similar to the A/Hong Kong/4801/2014-like cell-propagated reference virus belonging to genetic subgroup 3C.2a, representing the A (H3N2) component of the 2016–17 Northern Hemisphere vaccines. A smaller proportion of viruses were antigenically similar to the egg-propagated A/Hong Kong/4801/2014 reference virus representing the A (H3N2) vaccine component.
A total of 135 influenza B/Victoria-lineage viruses were characterized (59 international and 76 U.S.), and 133 (98.5%) were found to be similar to B/Brisbane/60/2008, the reference vaccine virus representing the influenza B/Victoria-lineage component of the 2016–17 Northern Hemisphere trivalent and quadrivalent vaccines. Two (1.5%) of the B/Victoria-lineage viruses tested had reduced titers to B/Brisbane/60/2008. All B/Victoria-lineage viruses sequenced (57 international and 73 U.S.) belong to genetic group V1A, the same genetic group as the vaccine reference virus.
A total of 101 influenza B/Yamagata-lineage viruses were characterized (24 international and 77 U.S.), and all were similar to B/Phuket/3073/2013, the reference vaccine virus representing the influenza B/Yamagata-lineage component of the 2016–17 Northern Hemisphere quadrivalent vaccines. All influenza B/Yamagata-lineage viruses sequenced (23 international and 74 U.S.) belong to genetic group Y2 or Y3, with viruses in the Y3 genetic group (the same genetic group as the vaccine reference virus) predominating.
Additional viruses have been characterized by the other Collaborating Centers. That information is presented elsewhere (2).
Antiviral Resistance Profiles of Influenza Virus Isolates
The WHO Collaborating Center for Surveillance, Epidemiology, and Control of Influenza at CDC tested 461 influenza virus specimens collected during May 1–September 10 from the United States and worldwide for resistance to the influenza neuraminidase inhibitor antiviral medications currently approved for use against seasonal influenza: oseltamivir, peramivir, and zanamivir. Among 141 influenza A (H1N1)pdm09 viruses (98 international and 43 U.S.) tested for oseltamivir and peramivir susceptibility, two (1.4%) were resistant to both drugs. A total of 137 of the influenza A (H1N1)pdm09 viruses also were tested for zanamivir susceptibility and all were susceptible. All 117 influenza A (H3N2) viruses (24 international and 93 U.S.) and all 203 influenza B viruses (51 international and 152 U.S.) tested for oseltamivir, peramivir, and zanamivir susceptibility were sensitive to all three recommended antiviral medications. High levels of resistance to the adamantanes (amantadine and rimantadine) persist among influenza A (H1N1)pdm09 and influenza A (H3N2) viruses. Adamantane drugs continue to not be recommended for use against influenza at this time.
Discussion
During May 22–September 10, 2016, influenza A (H3N2), influenza A (H1N1)pdm09 and influenza B viruses co-circulated worldwide. In the United States, low levels of influenza activity were reported overall, with influenza B viruses more frequently reported through June and influenza A viruses reported more frequently since the beginning of July. A small number of localized outbreaks caused by influenza A (H3N2) viruses were reported in late August and early September. Although overall influenza activity remains low and below epidemic thresholds, because of recent reports of influenza activity, the possibility of influenza virus infection in persons with influenza-like illness should be considered. The majority of the influenza viruses collected from the United States and other countries during May–September were characterized antigenically or genetically or both as being similar to the reference viruses representing vaccine components recommended for the 2016–17 Northern Hemisphere influenza vaccines. Antigenic and genetic characterization of circulating influenza viruses can give an indication of the influenza vaccine's ability to produce an immune response against circulating influenza viruses, but vaccine effectiveness studies are needed to determine how much protection has been provided to the community by vaccination. It is not possible to predict which influenza virus will predominate, how severe influenza-related disease activity will be, or how effective influenza vaccine will be during the 2016–17 season. However, since February 2016, CDC’s laboratory-based studies of approximately 5,000 influenza viruses found that most circulating viruses do not have significant antigenic changes. These findings are in contrast to the 2014–15 season, when influenza A (H3N2) viruses collected in late summer showed significant changes (drift) compared with the recommended vaccine virus. In addition, although many factors can affect the effectiveness of the influenza vaccine, making it impossible to predict how effective this season’s influenza vaccine will be, the low level of vaccine effectiveness caused by antigenic drift during the 2014–15 influenza season is not anticipated. CDC will continue to monitor influenza viruses throughout the season and will provide updates as the season progresses.
Annual influenza vaccination is the best method for preventing influenza and its potentially severe complications (3). Although vaccine effectiveness can vary, vaccination has been found to reduce influenza illnesses, doctor visits, and influenza-related hospitalizations (4). Substantial public health impact can still be attained during seasons when vaccine effectiveness is reduced (4–6). In the United States, annual influenza vaccination is recommended for all persons aged ≥6 months. Annual influenza vaccination is recommended regardless of whether the vaccine composition has changed because immunity from vaccination might wane after one season. For the 2016–17 influenza season, interim supply projections by manufacturers for the U.S. market range from 157 million to 168 million doses of vaccine.
Multiple influenza vaccines are approved and recommended for use and are being distributed during the 2016–17 season, including unadjuvanted, egg-based trivalent and quadrivalent inactivated influenza vaccines (IIV3 and IIV4), adjuvanted trivalent egg-based inactivated influenza vaccines (aIIV3), high-dose trivalent egg-based inactivated influenza vaccines (hd IIV3), quadrivalent cell culture–based inactivated influenza vaccines (ccIIV4), and recombinant trivalent influenza vaccines (RIV3). One IIV4 formulation also is approved for intradermal administration. For the 2016–17 season, the Advisory Committee on Immunization Practices and CDC recommend that quadrivalent live attenuated intranasal influenza vaccine (LAIV4) not be used because of concerns about effectiveness (3). For the 2016–17 season, children aged 6 months–8 years who have previously received ≥2 total doses of trivalent or quadrivalent influenza vaccine at any time before July 1, 2016, require only 1 dose for 2016–17 (3). The previous 2 doses do not need to have been given during the same or consecutive seasons (3). Children in this age group who are being vaccinated for the first time or who have not previously received a total of ≥2 doses before July 1, 2016, require 2 doses of influenza vaccine administered ≥4 weeks apart (7).
Although vaccination is the best method for preventing and reducing the impact of influenza, antiviral medications are a valuable adjunct. Treatment with influenza antiviral medications as early as possible in the course of illness is recommended for patients with confirmed or suspected influenza (either seasonal influenza or novel influenza virus infection) who have severe, complicated, or progressive illness; who require hospitalization; or who are at high risk for influenza-related complications¶¶¶ (8). Treatment is most effective when given early in the illness, especially within 48 hours of illness onset; providers should not delay treatment until test results become available and should not rely on insensitive assays such as rapid antigen detection influenza diagnostic tests to determine treatment decisions (8).
Testing for seasonal influenza viruses and monitoring for novel influenza A virus infections, including influenza variant virus infections, should continue year-round, as should specimen submission to CDC for further antigenic and genetic analysis and antiviral resistance monitoring. Health care providers should consider novel influenza viruses in ill persons with swine exposure. The illness associated with variant virus infections has been similar to symptoms of uncomplicated seasonal influenza including fever, cough, pharyngitis, rhinorrhea, myalgia, and headache. Vomiting and diarrhea also have been reported in some infections in children. Milder clinical illness is possible, including lack of fever. Public health laboratories should immediately send virus specimens that they cannot type or subtype using standard methods to CDC and submit all specimens that are otherwise unusual as soon as possible after identification. Twenty infections with variant influenza viruses were reported from four states in 2016, compared with six viruses from five states in 2015. In 2016, most of these infections occurred in children with direct contact with pigs at agricultural fairs, highlighting the importance of preventive actions, especially for young children or persons at high risk for serious influenza-associated complications.**** Although community transmission of these viruses has not been identified, the potential for these viruses to develop the ability to be efficiently transmitted from person to person remains a concern. Early identification and investigation of human infections with novel influenza A viruses are critical to ensure timely risk assessment so that appropriate public health measures can be taken.
Influenza surveillance reports for the United States are posted online weekly and are available at http://www.cdc.gov/flu/weekly. Additional information regarding influenza viruses, influenza surveillance, influenza vaccines, influenza antiviral medications, and novel influenza A virus infections in humans is available at http://www.cdc.gov/flu.
Acknowledgments
State, county, city, and territorial health departments and public health laboratories; U.S. World Health Organization collaborating laboratories; National Respiratory and Enteric Virus Surveillance System laboratories; U.S. Outpatient Influenza-Like Illness Surveillance Network sites; National Center for Health Statistics, CDC; 122 Cities Mortality Reporting System; World Health Organization, FluNet; Angie Foust, Elisabeth Blanchard, Priya Budhathoki, Thomas Rowe, Lizheng Guo, Ewelina Lyszkowicz, Shoshona Le, Malania Wilson, Juliana DaSilva, Alma Trujillo, Michael Hillman, Katherine Roguski, Thomas Stark, Samuel Shepard, Sujatha Seenu, Ha Nguyen, Vasiliy Mishin, Erin Hodges, Lori Lollis, Michelle Adamczyk, Juan De la Cruz, Influenza Division, National Center for Immunization and Respiratory Diseases, CDC.
Corresponding author: Alicia Budd, abudd@cdc.gov, 404-639-3747.
References
- World Health Organization. Influenza: WHO Collaborating Centers and Essential Regulatory Laboratories. Geneva, Switzerland: World Health Organization; 2016.http://www.who.int/influenza/gisrs_laboratory/collaborating_centres/en
- World Health Organization. FluNet. Geneva, Switzerland: World Health Organization; 2016. http://www.who.int/influenza/gisrs_laboratory/flunet/en
- Grohskopf LA, Sokolow LZ, Broder KR, et al. Prevention and control of seasonal influenza with vaccines: recommendations of the Advisory Committee on Immunization Practices (ACIP)—United States, 2016–17 influenza season. MMWR Recomm Rep 2016;65(No. RR-5). CrossRef
- Reed C, Kim IK, Singleton JA, et al. Estimated influenza illnesses and hospitalizations averted by vaccination—United States, 2013–14 influenza season. MMWR Morb Mortal Wkly Rep 2014;63:1151–4. PubMed
- Kostova D, Reed C, Finelli L, et al. Influenza illness and hospitalizations averted by influenza vaccination in the United States, 2005–2011. PLoS One 2013;8:e66312. CrossRef PubMed
- Fry AM, Kim IK, Reed C, et al. Modeling the effect of different vaccine effectiveness estimates on the number of vaccine-prevented influenza-associated hospitalizations in older adults. Clin Infect Dis 2014;59:406–9. CrossRef PubMed
- Neuzil KM, Jackson LA, Nelson J, et al. Immunogenicity and reactogenicity of 1 versus 2 doses of trivalent inactivated influenza vaccine in vaccine-naive 5–8-year-old children. J Infect Dis 2006;194:1032–9. CrossRef PubMed
- Fiore AE, Fry A, Shay D, Gubareva L, Bresee JS, Uyeki TM. Antiviral agents for the treatment and chemoprophylaxis of influenza—recommendations of the Advisory Committee on Immunization Practices (ACIP). MMWR Recomm Rep 2011;60(No. RR-1). PubMed
* Data as of September 16, 2016.
† Influenza viruses that circulate in swine are called swine influenza viruses when isolated from swine, but are called variant influenza viruses when isolated from humans. Seasonal influenza viruses that circulate worldwide in the human population have important antigenic and genetic differences from influenza viruses circulating in swine.
§ The CDC influenza surveillance system collects information in five categories from nine data sources: 1) viral surveillance (U.S. World Health Organization collaborating laboratories, the National Respiratory and Enteric Virus Surveillance System, and novel influenza A virus case reporting); 2) outpatient illness surveillance (U.S. Outpatient Influenza-Like Illness Surveillance Network [ILINet]); 3) mortality (National Center for Health Statistics Mortality Surveillance System, 122 Cities Mortality Reporting System, and influenza-associated pediatric mortality reports); 4) hospitalizations (Influenza Hospitalization Surveillance Network [FluSurv-NET], which includes the Emerging Infections Program and surveillance in three additional states); and 5) summary of the geographic spread of influenza (state and territorial epidemiologist reports).
** The 10 regions include the following jurisdictions: Region 1: Connecticut, Maine, Massachusetts, New Hampshire, Rhode Island, and Vermont; Region 2: New Jersey, New York, Puerto Rico, and the U.S. Virgin Islands; Region 3: Delaware, District of Columbia, Maryland, Pennsylvania, Virginia, and West Virginia; Region 4: Alabama, Florida, Georgia, Kentucky, Mississippi, North Carolina, South Carolina, and Tennessee; Region 5: Illinois, Indiana, Michigan, Minnesota, Ohio, and Wisconsin; Region 6: Arkansas, Louisiana, New Mexico, Oklahoma, and Texas; Region 7: Iowa, Kansas, Missouri, and Nebraska; Region 8: Colorado, Montana, North Dakota, South Dakota, Utah, and Wyoming; Region 9: Arizona, California, Hawaii, Nevada, American Samoa, Commonwealth of the Northern Mariana Islands, Federated States of Micronesia, Guam, Marshall Islands, and Republic of Palau; Region 10: Alaska, Idaho, Oregon, and Washington.
†† Defined as a temperature ≥100°F (≥37.8°C), oral or equivalent, and cough and/or sore throat, without a known cause other than influenza.
§§ The national baseline is the mean percentage of visits for ILI during noninfluenza weeks for the previous three seasons plus two standard deviations. Noninfluenza weeks are defined as periods of ≥2 consecutive weeks in which each week accounted for <2% of the season’s total number of specimens that tested positive for influenza. The national percentage of patient visits for ILI is weighted based on state population.
¶¶ Pneumonia and influenza (P&I)-associated deaths are tracked through two systems, the National Center for Health Statistics (NCHS) Mortality Surveillance System, which reports the week the death occurred, and the 122 Cities Mortality Reporting System, which reports the week that the death certificate was registered. Because of these differences in reporting, the two data sources produce different percentages. Beginning with the 2015–16 influenza season, the NCHS Mortality Surveillance System has been the principal component of the U.S. Mortality Surveillance System.
*** The seasonal baseline proportion of P&I deaths is projected using a robust regression procedure, in which a periodic regression model is applied to the observed percentage of deaths caused by P&I that were reported by the NCHS Mortality Surveillance System and the 122 Cities Mortality Reporting System during the preceding 5 years. The epidemic threshold is set at 1.645 standard deviations above the seasonal baseline. Users of the data should not expect the NCHS mortality surveillance data and the 122 Cities Mortality Reporting System to produce the same percentages, and the percent P&I deaths from each system should be compared with the corresponding system specific baselines and thresholds.
††† In temperate climates, the onset and peak of influenza activity might vary substantially from one influenza season to the next, but generally begins to increase in the late fall. In the Northern Hemisphere's temperate regions, annual epidemics of influenza typically occur during October–February, but the peak of influenza activity can occur as late as April or May. In temperate regions of the Southern Hemisphere, influenza activity typically peaks during May through August. Although temperate regions of the world experience a seasonal peak in influenza activity, influenza viruses can be isolated year-round. The timing of seasonal peaks in influenza activity in tropical and subtropical countries varies by region. Multiple peaks of activity during the same year have been seen in some areas and influenza infection can occur year-round.
§§§ The list of WHO monthly risk assessment summaries for human infections with avian influenza viruses is available athttp://www.who.int/influenza/human_animal_interface/HAI_Risk_Assessment/en/ and WHO disease outbreak news reports are available at http://www.who.int/csr/don/en/.
¶¶¶ Persons at high risk include 1) children aged <5 years (especially those aged <2 years); 2) adults aged ≥65 years; 3) persons with chronic pulmonary (including asthma), cardiovascular (except hypertension alone), renal, hepatic, hematologic (including sickle cell disease), metabolic disorders (including diabetes mellitus), or neurologic and neurodevelopment conditions (including disorders of the brain, spinal cord, peripheral nerves, and muscles, such as cerebral palsy, epilepsy [seizure disorders], stroke, intellectual disability [mental retardation], moderate to severe developmental delay, muscular dystrophy, or spinal cord injury); 4) persons with immunosuppression, including that caused by medications or by human immunodeficiency virus infection; 5) women who are pregnant or postpartum (within 2 weeks after delivery); 6) persons aged ≤18 years who are receiving long-term aspirin therapy; 7) American Indians/Alaska Natives; 8) persons with extreme obesity (i.e., with a body mass index ≥40); and 9) residents of nursing homes and other chronic care facilities.
**** Guidance for preventing the spread of variant influenza viruses is available at http://www.cdc.gov/flu/swineflu/variant-guidance.htm.
 FIGURE 1. Number of influenza positive tests* reported to CDC by public health laboratories, by virus subtype/lineage and week — United States, October 4, 2015–September 10, 2016†
* N = 76,293.
† As of September 16, 2016.


.png)


No hay comentarios:
Publicar un comentario