02/07/2017 09:00 AM EST

The human brain contains distinct geographic regions that communicate throughout the day to process information, such as remembering a neighbor’s name or deciding which road to take to work. Key to such processing is a vast network of densely bundled nerve fibers called tracts. It’s estimated that there are thousands of these tracts, and, because […]
Cool Videos: Starring the Wiring Diagram of the Human Brain
 The human brain contains distinct geographic regions that communicate throughout the day to process information, such as remembering a neighbor’s name or deciding which road to take to work. Key to such processing is a vast network of densely bundled nerve fibers called tracts. It’s estimated that there are thousands of these tracts, and, because the human brain is so tightly packed with cells, they often travel winding, contorted paths to form their critical connections. That situation has previously difficult for researchers to image three-dimensional tracts in the brain of a living person.
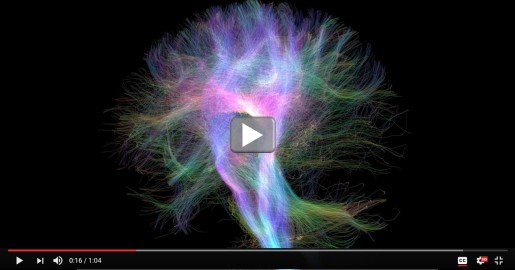
That’s now changing with a new approach called tractography, which is shown with the 3D data visualization technique featured in this video. Here, researchers zoom in and visualize some of the neural connections detected with tractography that originate or terminate near the hippocampus, which is a region of the brain essential to learning and memory. If you’re wondering about what the various colors represent, they indicate a tract’s orientation within the brain: side to side is red, front to back is green, and top to bottom is blue.
The video is the work of Tyler Ard, a neuroscientist in the NIH-supported lab of Arthur Toga at the Keck School of Medicine of the University of Southern California, Los Angeles. As Ard points out, tractography is far more than just cool 3D pictures of the brain’s wiring. The technique is a mainstay in the Human Connectome Project, which has set out to map the brain’s neural connections in their entirety. With further refinements, tractography could also one day be used for even more pinpoint imaging of the brain’s circuitry, potentially bringing greater precision to diagnosis, treatment, and prevention of neurological disorders. Such efforts are already underway as part of the Brain Research through Advancing Innovative Neurotechnologies (BRAIN®) Initiative.
Tractography starts with a special type of magnetic resonance imaging called diffusion MRI. During such a scan, 3D MRI images are taken in a way that shows the normal passage, or diffusion, of water along the brain’s nerve fibers. All the data are loaded into a supercomputer programmed to measure path of the diffusion from multiple angles and infer the location and direction of a tract. Special software then visualizes the calculations.
Getting the data right is not only challenging with such a relatively new technique, it’s fraught with trial and error, all the way from data collection to tracking the convoluted path of a tract. To give you an idea, the best possible resolution of each individual measurement is about 2 millimeters (0.078 of an inch), large enough to pack in tens of thousands of nerve fibers.
That’s where Ard enters the picture. As a data visualization investigator, Ard spends his days in the lab trying to develop better programs and algorithms that will make complex neuroimaging information more understandable, cutting down on the errors and making the visualization process more intuitive, useful, and applicable.
Ard has assembled an impressive library of tractography videos. This one, now with narration added by Ard himself, was recently highlighted in the Brain-Art Competition 2016, sponsored by The Neuro Bureau. If you liked this video, take a look at some of the other offerings in the link below.
Links:
Brain Basics (National Institute of Mental Health/NIH)
Magnetic Resonance Imaging (National Institute of Biomedical Imaging and Bioengineering/NIH)
Laboratory of Neuro Imaging (University of Southern California, Los Angeles)
Brain-Art Competition 2016 (The Neuro Bureau)
NIH Support: National Institute of Biomedical Imaging and Bioengineering; National Institute of Neurological Disorders and Stroke; National Institute of Mental Health


.png)


No hay comentarios:
Publicar un comentario