
MMWR Weekly
Vol. 66, No. 6
February 17, 2017
QuickStats: Percentage* of Total Daily Kilocalories† Consumed from Sugar-Sweetened Beverages§ Among Children and Adults, by Sex and Income Level¶ — National Health and Nutrition Examination Survey, United States, 2011–2014
Weekly / February 17, 2017 / 66(6);181
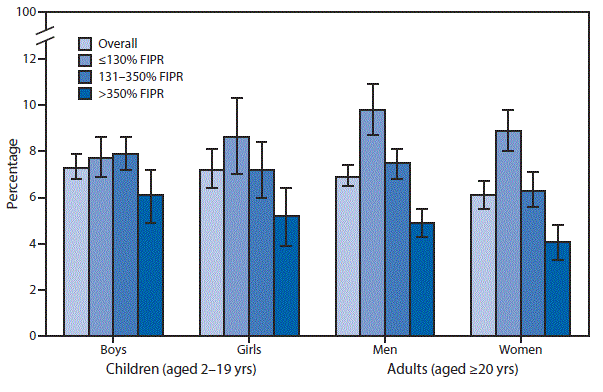
Abbreviations: FIPR = family income to poverty ratio; SSBs = sugar-sweetened beverages.
* With 95% confidence intervals indicated with error bars.
† Kilocalories are a measure representing dietary energy or calorie intake. Percentage of daily kilocalories from SSBs is calculated as a percent of total daily calories based on Day 1, 24-hour dietary intake data.
§ SSBs include regular soda, fruit drinks (including sweetened bottled waters and fruit juices and nectars with added sugars), sports and energy drinks, sweetened coffees and teas, and other SSBs. SSBs do not include diet drinks; 100% fruit juice; beverages sweetened by the participant, including coffee and teas; alcohol; or flavored milks.
¶ FIPR is an index based on the ratio of family income to the U.S. Department of Health and Human Services’ poverty guidelines.
During 2011–2014, on average, 7.3% of boys’ and 7.2% of girls’ total daily calories were obtained from SSBs compared with 6.9% for men and 6.1% for women. For men, women, and girls, the percentage of total daily kilocalories from SSBs declined as income level increased. For boys, the percentage of total daily kilocalories was lower for those in the highest income group than in the other income groups. Compared with women, a larger proportion of men’s total daily kilocalorie intake came from SSBs.
Source: Rosinger A, Herrick K, Gahche J, Park S. Sugar-sweetened beverage consumption among US adults, 2011–2014. NCHS Data Brief no. 270; 2017. https://www.cdc.gov/nchs/products/databriefs/db270.htm.
Rosinger A, Herrick K, Gahche J, Park S. Sugar-Sweetened beverage consumption among US youth, 2011–2014. NCHS Data Brief no. 271; 2017. https://www.cdc.gov/nchs/products/databriefs/db271.htm.
Reported by: Asher Rosinger, PhD, arosinger@cdc.gov, 301-458-4199; Kirsten Herrick, PhD; Jaime Gahche, MPH; Sohyun Park, PhD; Steven M. Frenk, PhD.



















No hay comentarios:
Publicar un comentario