
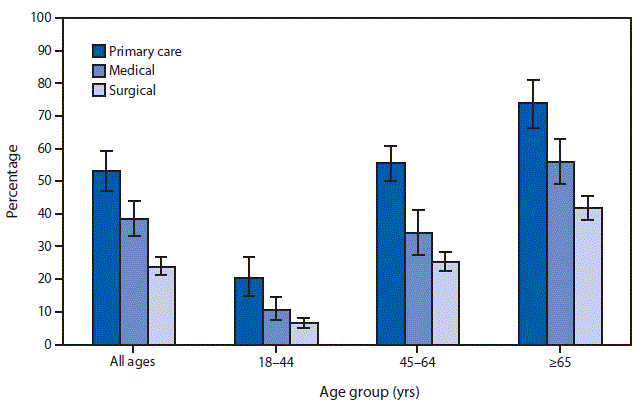
QuickStats: Percentage* of Visits by Patients Aged ≥18 Years to Office-Based Physicians† Made by Patients with ≥2 Selected Diagnosed Chronic Conditions,§ by Physician Specialty Category and Patient Age Group — National Ambulatory Medical Care Survey, 2015
Weekly / December 15, 2017 / 66(49);1367
* With 95% confidence intervals indicated by error bars.
† Based on a sample of visits to nonfederally employed office-based physicians who are primarily engaged in direct patient care. Physicians in specialties of anesthesiology, pathology, and radiology are excluded from the survey.
§ Defined as visits made by adults with documentation in the medical record of a diagnosis of ≥2 selected chronic conditions, regardless of the diagnosis of the current visit. Selected diagnosed chronic conditions include the 10 most frequent: hypertension; hyperlipidemia; arthritis; diabetes; depression; obesity; cancer; coronary artery disease, ischemic heart disease, and/or history of myocardial infarction; asthma; and chronic kidney disease.
In 2015, the percentage of office-based physician visits by adults with two or more diagnosed chronic conditions was 53.1% for primary care physicians, 38.5% for medical specialists, and 23.9% for surgeons. This pattern was observed for each of the age groups studied. The percentage of visits increased with age group, regardless of specialty category.
Source: National Ambulatory Medical Care Survey, 2015 data. https://www.cdc.gov/nchs/ahcd/ahcd_questionnaires.htm.
Reported by: Brian W. Ward, PhD, ijz8@cdc.gov, 301-458-4568; Kelly L. Myrick, PhD; Donald K. Cherry, MS.


.png)


No hay comentarios:
Publicar un comentario