An Automated Method of Mouse Antibody (IGG1) Purification
Shutterstock | media point inc
Antibodies (immunoglobulins (Igs)) are part of the immune system. They can detect and bind with certain antigens to neutralize them. Thanks to their specific target recognition/binding function, they play a key role in the biotechnology and pharmaceutical industries.
Major applications include the diagnosis and treatment of diseases. Also, antibodies are the vital components in several research applications such as immunoassays and Western Blots. For these applications, quality and purity of the IgG is essential.
Antibodies can be purified in two to three steps, 1. capture step, (2. intermediated step), 3. polishing step. The transition from one step to the other step usually involves manual intervention and thus is time consuming. The objective of this article was to establish an automated purification method on the AZURA Bio LC purification system combining an affinity chromatography step with a gel filtration step to exchange the buffer of the purified antibodies.
Results
A protein A column was used to purify mouse immunoglobulin (IgG1) from 10 mL cell culture by affinity chromatography. The chromatogram of the IgG purification depicts the four key steps of the procedure (Figure 1).
- Step 1: Equilibration of the protein A column with buffer A.
- Step 2: Injection of sample by the feed pump. The large flow through peak (A) visualizes the cell culture matrix and proteins not bound by the protein A column. The column was then washed with buffer A until no further peaks were identified.
- Step 3: Elution of the captured IgG1 with buffer B and parking in the sample loop (B1).
- Step 4: Immediate buffer exchange was carried out by flushing the system with exchange buffer C and subsequently re-injecting the IgG1 on the gel filtration column.
The fraction collector (B2) was used to recover the eluting peak. The major objective of the second step was the buffer exchange, shifting the pH from 3 to 7. The conductivity signal was recorded, illustrating the desalting of the eluates during the purification process (Figure 2).
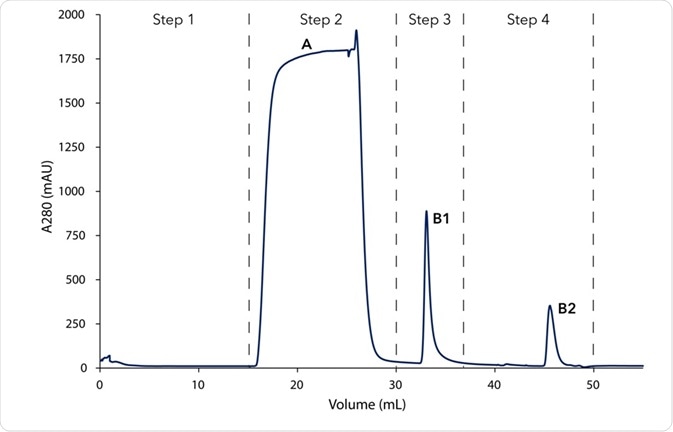
Figure 1. Chromatogram of the two-step mouse IgG purification; Step 1 - Affinity chromatography (AC): 1 Column equilibration with buffer A; 2 Feed injection and column washing; 3 Elution of IgG from protein A column with buffer B and parking in 1 mL sample loop; Step 2 - Buffer exchange with desalting column: 4. Elution of IgG with buffer C; A–flow through; B1–elution peak of IgG from protein A column; B2-elution peak of IgG after SEC desalting column.
Finally, an SDS-PAGE was conducted to control the results of the purification steps (Figure 2). The analysis of the flow through and comparison with the injected sample illustrate that some IgG1 did not bind to the protein A column (lane 1 and 2). The protein bands of IgG1 heavy chains (HC) and IgG1 light chains (LC) can be seen at 55 kDa and 22 kDa respectively in the SDS-PAGE.
Additionally, a larger un-specific band at 70 kDa was detected. This band was only detected in the flow through and not in the purified IgG (lane 2, 3, 4), indicating that IgG1 was not contaminated with other proteins. The IgG1 after the protein A column (lane 3) and the protein A / gel filtration column (lane 4) has a similar concentration, revealing the absence of protein loss in the second purification step.
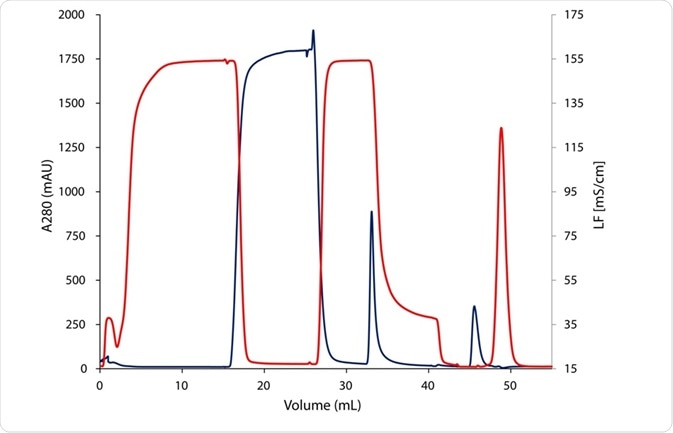
Figure 2. Chromatogram of the two step mouse IgG purification with UV and conductivity signal; UV signal at 280 nm in blue; conductivity signal in red; after desalting (45 minutes) elution peak (blue) and salt peak (red) are clearly separated.
Materials and Method
For this application, the AZURA Bio LC two-step purification system was used. It comprises of AZURA P 6.1L HPG; 1st ASM 2.1L with feed pump and two 6 port/3 channel injection valves; second ASM 2.1L with UVD 2.1S and two 6 port/3 channel injection valve; a column switching valve; a conductivity monitor and a fraction collector.
The protein A column (ZetaCell protein A, 1 ml) was equilibrated with 15 ml buffer A (TBS) at 1 mL/minute. Then 10 mL of feed at 1 mL/minute was injected and column was washed with 5 mL buffer A at 1 mL/minute.
Subsequently, the antibody was eluted with 10 mL elution buffer B (0.2 M Na Citrate, pH 3) and collected in sample loop. Finally, the protein was re-injected and eluted with 15 mL of buffer C (PBS pH 7.4) over the desalting/gel filtration column at 1 mL/minute. The conductivity signal and the UV signal (280 nm) were recorded.
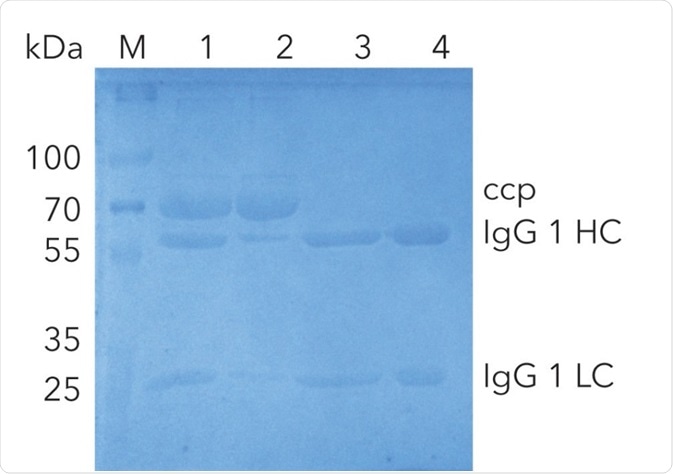
Figure 3. SDS-PAGE of IgG1 at different purification steps; M: Marker (3 µL) in kDa; 1-serum (15 µL); 2-flow through (15 µL); 3-IgG1 pure (15 µL) after elution from protein A column, intermediate step; 4-IgG1 pure (15 µL) after protein A and desalting column; ccp cell culture proteins; IgG1 HC (heavy chain); IgG1 LC (light chain).
Conclusion
Purification of mouse IgG from cell culture medium was successfully performed using an automated combination of an affinity chromatography and gel filtration method on the two-step dedicated AZURA Bio LC system without any manual interaction.
The method setup could easily be adapted to other purification procedures for biomolecule separation. This application demonstrates a time-saving automation of protein purification and can be easily adapted to various protein purification protocols.

This information has been sourced, reviewed and adapted from materials provided by KNAUER Wissenschaftliche Geräte GmbH.
For more information on this source, please visit KNAUER Wissenschaftliche Geräte GmbH.
Last updated: Feb 5, 2018 at 6:58 AM


.png)


No hay comentarios:
Publicar un comentario